Get in touch with Blue Membrane Company

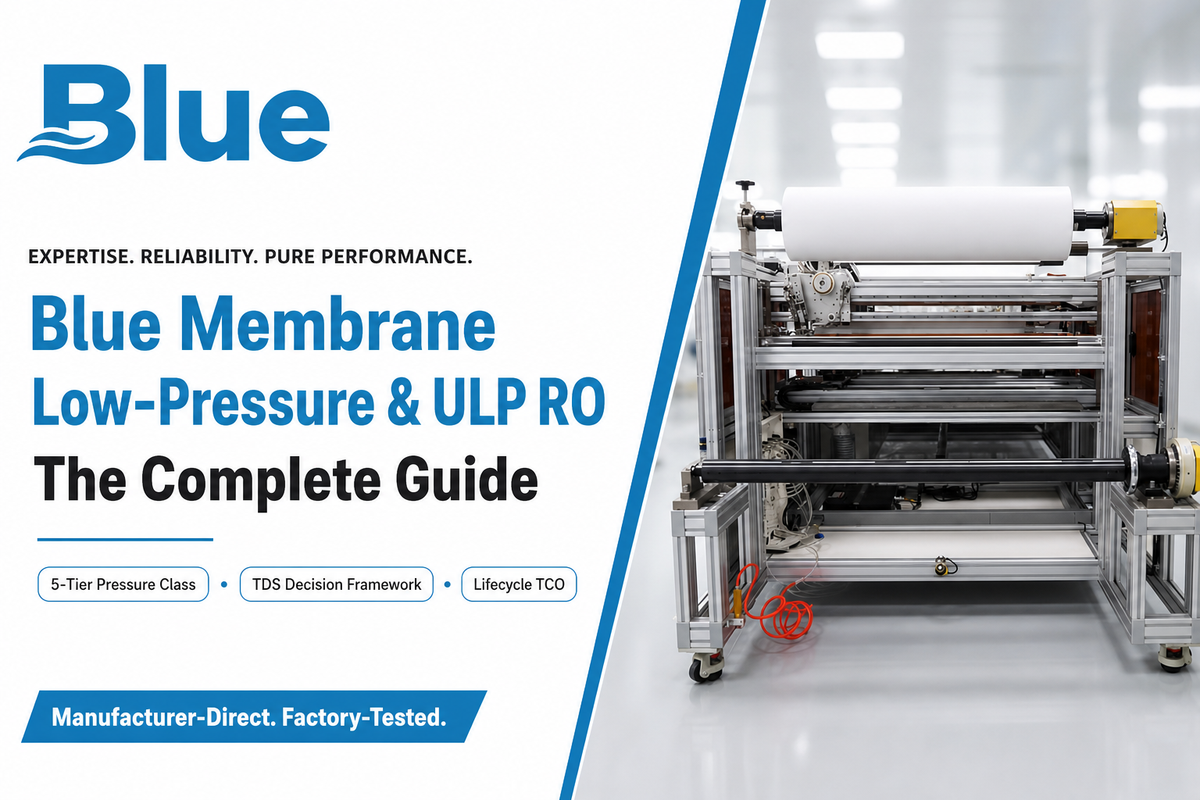
A low pressure ro membrane is a reverse-osmosis element engineered to produce the same clean permeate flow as a standard element while running at a lower operating pressure – usually 60-150 psi instead of 150-250 psi. That water-pressure difference registers directly on the electricity meter. This design choice alone can save energy by reducing pump duty on certain feed waters, but it’s only cost-effective when the feed chemistry, fouling control strategies, and test-basis assumptions it was based on are understood. Here, we’ll examine the water purification and water filtration engineering behind the product datasheets – the differences between pressure classes, how to properly select the right reverse osmosis water treatment for your feed water, how reverse osmosis membrane elements fail and are recovered from fouling, what these elements really cost in operation at actual feed-water temperatures, and why Datasheets from different suppliers that describe seemingly similar elements often fail to align.
Quick Specs – Low-Pressure & ULP RO Membrane Class
| Typical feed pressure | 60–150 psi (vs. 150–250 psi for standard BWRO) |
| Best-fit feed TDS | Below ~2,000 ppm |
| Typical salt rejection | 99.0–99.6% (stabilized) |
| Typical service life | 2–3 years with correct pretreatment |
| Governing test standard | ASTM D4194 (device-level); NSF/ANSI 58 (separate, system-level) |
TL;DR
- A 2025 peer-reviewed study showed that low-pressure ro membranes fail to degrade in a consistent way; their permeability and salt rejection properties decline over time in what the authors term ‘uneven ageing.’ The authors suggest these changes are more pronounced on one side of the module than on the other.
- A normalized flow decrease of 10-15 percent typically dictates cleaning of a membrane; it isn’t based on calendar dates.
- Datasheets that seem to contradict one another (e.g., 99.5 percent rejection at 2,000 ppm vs. 99.6 percent rejection at 1,500 ppm) are not necessarily wrong – each element is simply tested under different conditions, which are perfectly valid within the context of the ASTM D4194 testing method.
- Higher salt rejection isn’t necessarily better, because such elements require more pressure and consume more energy than a low-TDS application necessitates.
- This guide covers spiral-wound industrial and commercial RO water production, not the small under-sink cartridges, 0 TDS countertop filters, or booster pump troubleshooting guides written for residential drinking-water treating water or filter water setups – different hardware, different failure modes, different math.
What Is a Low-Pressure or ULP RO Membrane? The 5-Tier Pressure Spectrum
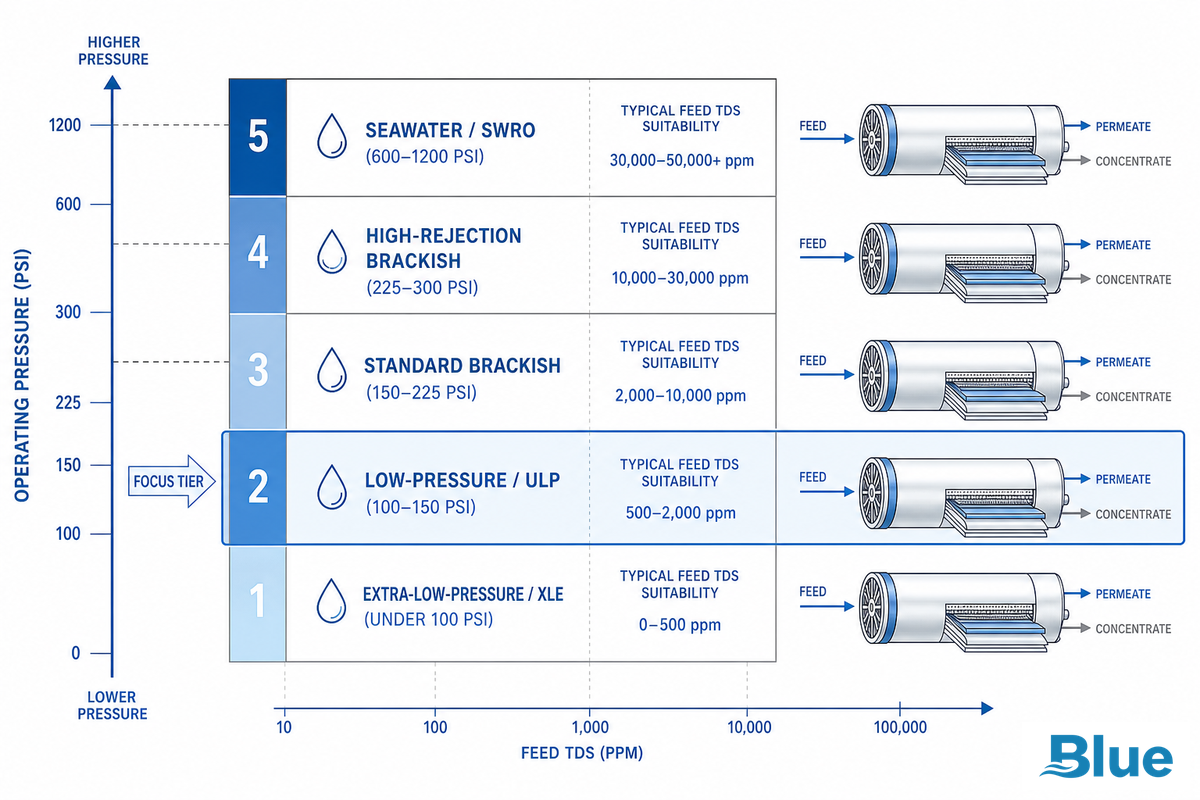
A low-pressure or ULP RO membrane is a dense, salt-rejecting reverse-osmosis element built with a thinner, more permeable active layer than a standard element, so it produces useful permeate flow at roughly 60-150 psi instead of the 150-250 psi a standard brackish-water element needs. It sits on a five-tier pressure spectrum running from extra-low-pressure (XLE) through low-pressure/ULP, standard brackish, high-rejection brackish, and seawater RO, each tier matched to a different feed-water salinity range.
Regarding terminology, when one encounters ‘low-pressure membrane’ in a general water treatment or desalination context, the reference is often to MF or UF membrane used in larger water systems as a pre-treatment stage: porous membranes operating below 15 psi, they reject solids and bacteria, but not dissolved salts. That isn’t the focus of this discussion. In this article, the terms ‘low-pressure’ and ‘ULP’ are applied to thin-film composite (TFC) reverse-osmosis membranes designed to reject dissolved salts and operate below the standard element’s typical operating pressures, using less pressure and thus consuming less energy – a distinctly different category of technology from MF/UF, though their pressure ranges may overlap numerically.
Membranes, such as reverse osmosis membrane, fall along a continuum of operating pressures, each suited to different economic applications. Here we outline The 5-Tier Membrane Pressure Spectrum – a general classification, vendor-neutral by nature, that no data sheet provides, since each manufacturer typically discusses only its own tier.
| Tier | Typical pressure | Typical feed TDS | Where it’s used |
|---|---|---|---|
| XLE / extra-low-pressure | ~60–100 psi | <500 ppm | Very low-TDS tap water, small commercial systems |
| Low-pressure / ULP | 100–150 psi | <2,000 ppm | Municipal, F&B process water, commercial pure water |
| Standard brackish-water (BWRO) | 150–250 psi | 2,000–10,000 ppm | Brackish groundwater, industrial process water |
| High-rejection brackish | 225–400 psi | up to ~10,000 ppm | Higher-salinity brackish, stricter rejection targets |
| Seawater RO (SWRO) | 800–1,200 psi | 30,000–45,000 ppm | Seawater desalination |
Reverse osmosis works the same at every rung: pump feed water through a semi-permeable membrane under a pressure maintained higher than feed-osmotic pressure, which increases with dissolved-solids content. Seawater (on top) represents extreme dissolved solids; low-pressure and ULP elements (at bottom) are thin, permeable-membrane designed to produce a flow at less intense osmotic pressures. A water treatment industry publication documents a low-pressure TFC membrane element line with a rated capacity around 32 m³/day (roughly 8,500 gpd) at 99.8% salt rejection, confirming that the “low pressure” designation doesn’t mean a compromise on rejection when total dissolved solids in the feed water sit inside its designed window (spec sheets give product water output in gallons/day (gpd) in North America, vs cubic meters/day elsewhere – so check your unit when comparing capacities). The ion composition of the feed matters here too, not just the raw TDS number. A University of Nebraska-Lincoln extension publication on reverse osmosis drinking-water treatment covers the same osmotic-pressure fundamentals that separate these tiers.
⚠️ Important
A low-pressure element is not the fix for a system with lost pressure. Falling pressure and output in a system in use are most often attributable to scaling, fouling, or pump issues-check below to diagnose; they’re never a signal that you need to install a lower pressure-rated element.
Low-Pressure vs Standard (High-Pressure) RO Membranes – What Actually Changes
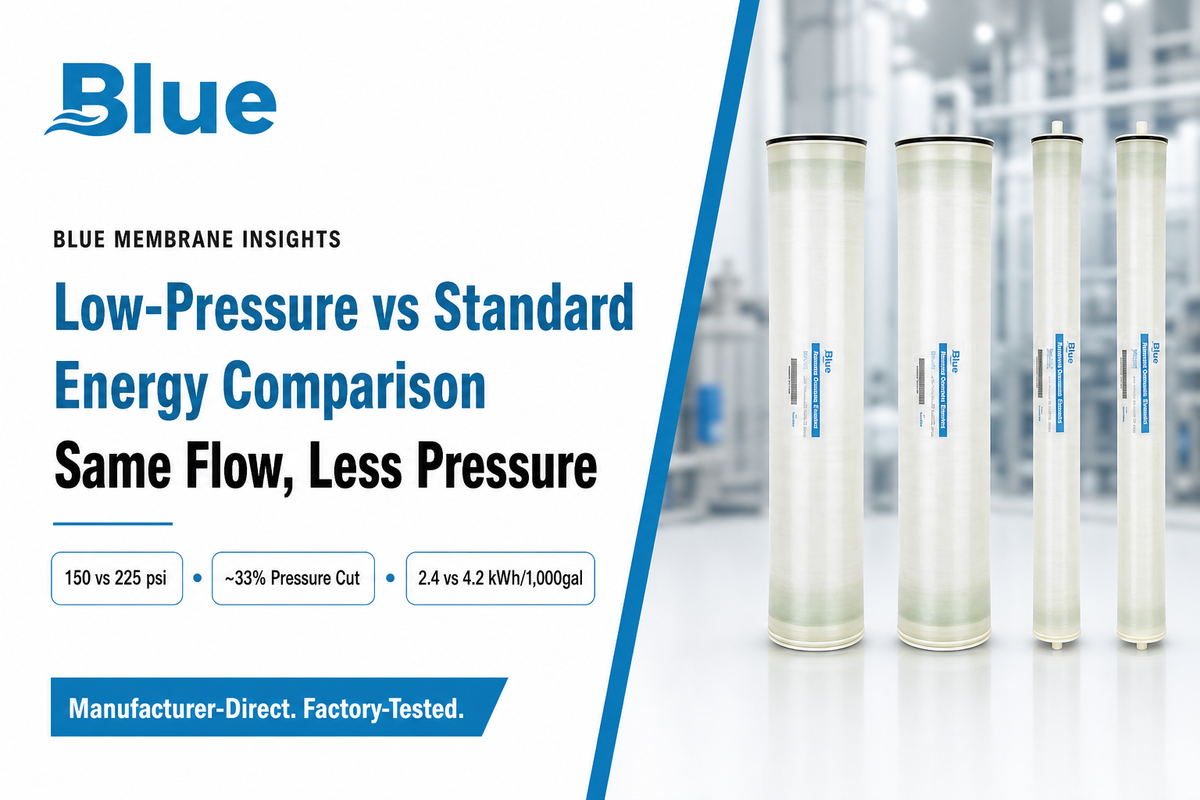
What is the difference between low pressure reverse osmosis membranes and high pressure reverse osmosis membranes?
A low-pressure element relies on a thinner, more permeable active layer that reaches effective rejection at a lower net driving pressure than a standard element needs for the same flow. A high-pressure brackish-water membrane instead uses a thicker layer to hold rejection in high-TDS, unpredictable feed, costing more pump pressure and energy per gallon. It’s not simply “turned down” — the two are built for different feed-water jobs.
| Trait | Low-pressure / ULP | Standard (high-pressure) BWRO |
|---|---|---|
| Active layer | Thinner, more permeable polyamide TFC | Denser polyamide TFC, higher mechanical tolerance |
| Typical test pressure | 100–150 psi | 150–250 psi |
| Best-fit feed TDS | <2,000 ppm | 2,000–10,000 ppm |
| Feed-quality tolerance | Lower — needs cleaner, lower-TDS feed to perform well | Higher — built for more variable, higher-TDS feed |
| Where it loses | Advantage narrows fast as feed TDS climbs | Wastes pump energy on genuinely low-TDS feed |
💡 Pro Tip
High salt-rejection numbers aren’t always desirable. Using an element that offers a higher rate of rejection than your application actually needs means you’re running an over-designed reverse osmosis at higher than necessary pressure; the pump cost of those “rejection reserves” adds up every day. Size based on the actual rejection rate required, not on the best number on the data sheet.
Here’s the practical call: in most common RO applications, when feed TDS is well under 2,000 ppm and relatively consistent- municipal water, some process waters, shallow well waters (free of heavy scale risk)-low-pressure elements will give you a lower cost to operate and a lower overall energy draw. When feed TDS are higher, more unpredictable, or when your process truly requires the utmost possible salt removal-for instance, high-purity water for pharmaceuticals from an untreated feed-a higher-rejection or standard-high-pressure element will justify the greater energy expenditure. Oversizing rejection is a very common-and very expensive-selection error that results in the daily energy drain of running the wrong element unnecessarily, and it shows up directly in the facility’s energy consumption line. A U.S. Department of Energy reverse-osmosis optimization study documents exactly this kind of pressure/recovery tradeoff for commercial RO and low energy commercial RO membrane systems alike, with proper pretreatment lifting system recovery from 60% to 95% on the same feed and achieving high removal of dissolved solids without the pressure penalty.
Matching Pressure Class to Your Feed Water – A TDS-Based Decision Framework
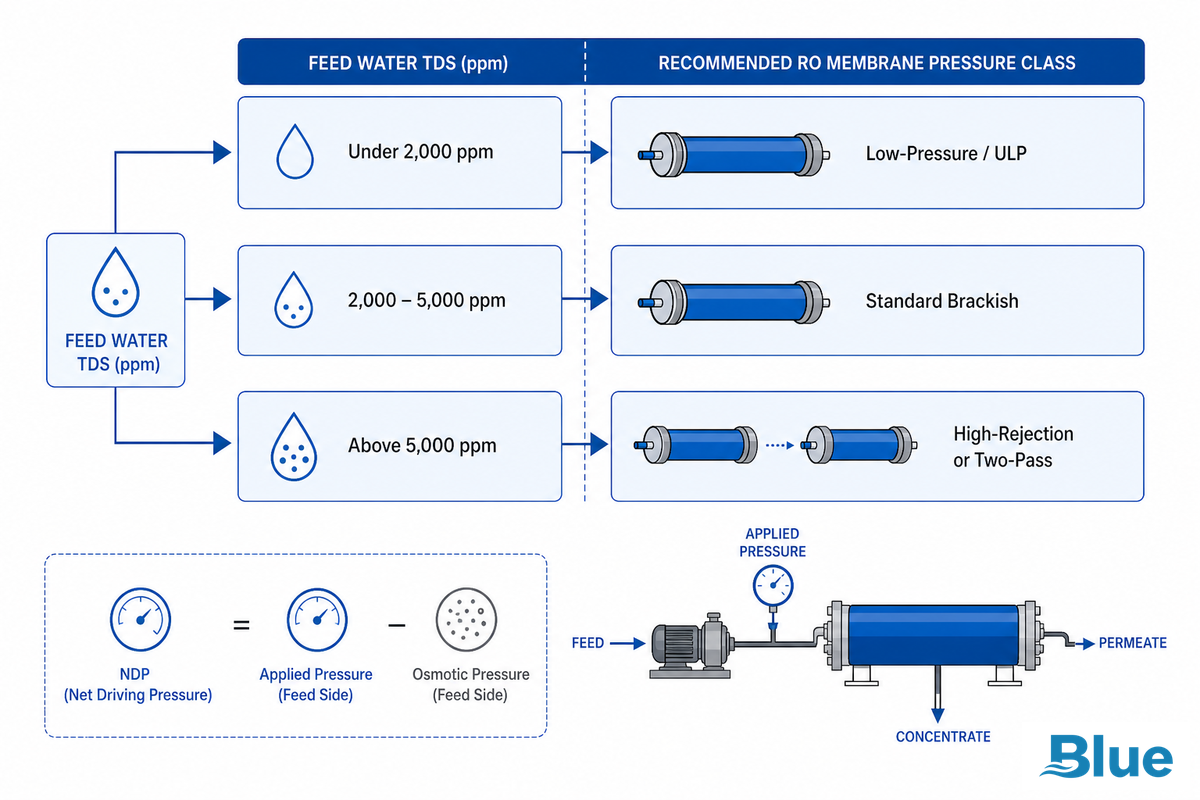
Every membrane pressure-class choice begins with the exact same question: what’s the dissolved solids content in the water that’s really entering your system and also just how much osmotic pressure robs from your usable driving pressure? That single pressure requirement number, more than any brand preference, decides whether a low-pressure element or a standard one belongs on the job – it applies just as much to municipal desalination projects as it does to a single commercial water desalination skid.
It’s just when applied pressure is greater than the osmotic pressure of the feed water- and that net driving pressure is what’s actually left- that net permeate flow-and also higher water flux- occurs in a reverse osmosis membrane to produce pure, filtered output water. Water flux as well as water yield are both proportional to net driving pressure, making pressure-class choice based on feed-water quality your first – not last- consideration.
📐 Engineering Note — worked example
Rule of thumb, per a University of Nebraska-Lincoln Extension guide to RO drinking-water treatment – osmotic pressure typically increases by 1 psi for every 100 ppm TDS of feed water. So, a 1,500 ppm feed will have ~15 psi of osmotic back-pressure on it even before the first permeate gets up to speed. Net driving pressure for a low-pressure element rated at 100 psi is thus 100-15=85 psi when dealing with a 1,500 ppm feed.
Do the same math for a 4,000 ppm feed and the osmotic cost jumps to 40 psi- a 100 psi low-pressure element has all but given up the fight by then, which is why the low pressure advantage tends to decrease with increasing feed TDS. The 1 psi / 100 ppm guide line is based on average, chloride and sodium dominated municipal and brackish water sources, high hardness feeds or those with exotic mixtures of divalent salts will experience larger osmotic effects, as the actual measure that drives osmotic pressure is osmolality, not mass TDS, although the two tend to correlate fairly well. If you’re dealing with anything other than fairly typical municipal or brackish water chemistry, an osmotic pressure calculation or a bench test is recommended instead of this rule of thumb.
Changing that from a number into a decision is actually the most valuable thing at spec time:
| Feed TDS & source | Recommended class | Why |
|---|---|---|
| <500 ppm, municipal tap | XLE / extra-low-pressure | Minimal osmotic penalty — smallest pump, lowest energy per gallon |
| 500–2,000 ppm, municipal / stable well | Low-pressure / ULP | Sweet spot for the pressure-class energy advantage |
| 2,000–5,000 ppm, brackish groundwater | Standard BWRO | Low-pressure advantage has largely eroded; standard element handles variability better |
| Surface water or reuse feed, any TDS | Match TDS band above, but add UF pretreatment | Fouling risk, not pressure class, is the binding constraint here |
| >5,000 ppm or highly variable industrial feed | High-rejection or two-pass design | Low-pressure and standard elements both lose rejection margin at this range |
Membrane Fouling in Low-Pressure Systems – Types, Diagnosis & Cleaning (CIP)
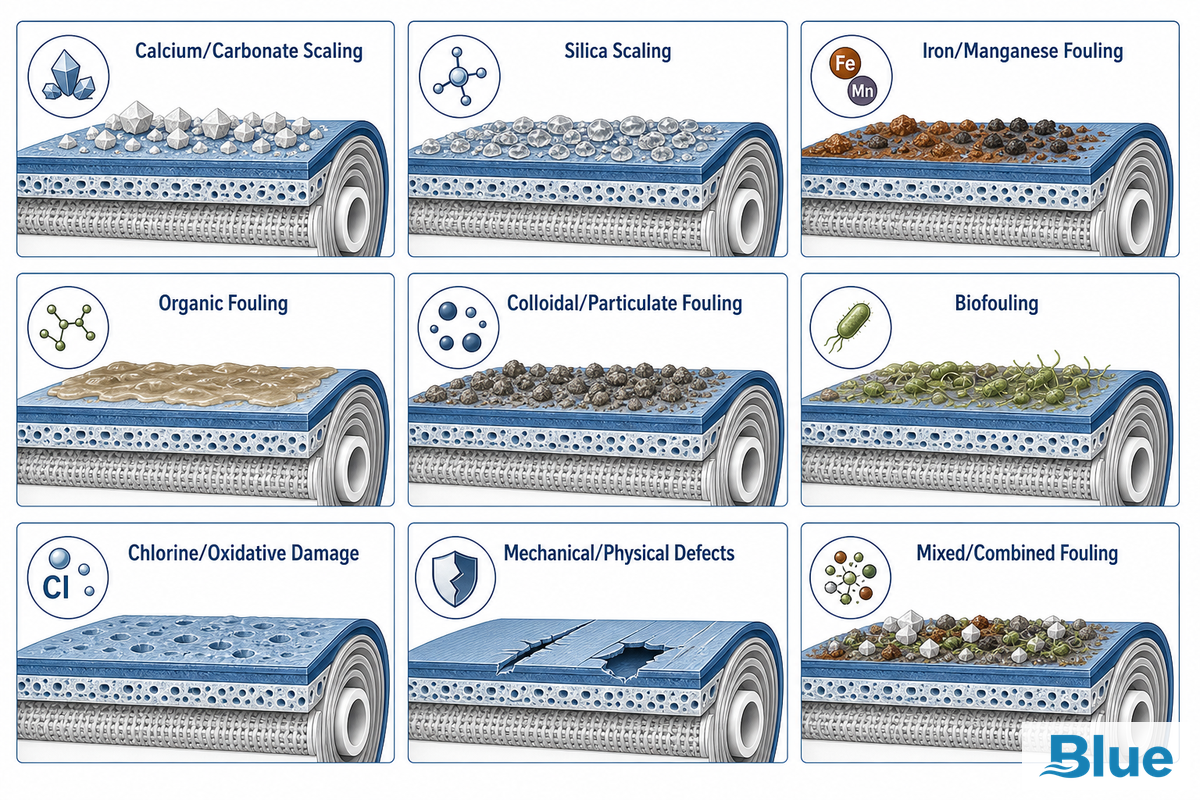
Per a National Institutes of Health review of RO membrane fouling, fouling impairs both permeability and rejection, and it’s the leading cause of any low pressure system failing to meet its designed flow rate. This is because the low pressure elements begin with inherently less spare driving pressure than an equivalent standard element, so they can tolerate less fouling before the impacts are easily seen – this makes identifying and resolving the issue properly all the more valuable in this pressure class than any other.
The 15% Normalized-Flow Rule
In water-treatment engineering practice, a normalized permeate flow drop of approximately 10-15% (flow compensated for feed pressure and temperature, not raw flow) is typically used to initiate cleaning-in-place instead of a calendar schedule. Beyond that level, fouling becomes less likely to be removable by the chemistry and capacity loss becomes possible; below that level it generally remains removable. Normalizing flow (not raw flow, which varies wildly with temperature) makes the point of no return more consistent and less arbitrary.
| Fouling type | Symptom pattern | Typical cause | Cleaning / corrective approach |
|---|---|---|---|
| Calcium/carbonate scaling | Rising differential pressure, worse at the last stage/tail elements | Calcium carbonate precipitation past solubility limit | Low-pH acid clean (citric or similar) |
| Silica scaling | Slow, hard-to-reverse flux decline concentrated at the tail elements | Silica exceeding solubility as water concentrates through the array | High-pH clean before silica polymerizes; prevention (antiscalant) beats cure here |
| Iron/manganese fouling | Reddish-brown or dark deposits visible at element autopsy | Dissolved iron/manganese oxidizing on contact with the membrane surface | Acid clean with a reducing agent; remove iron upstream, not at the membrane |
| Organic fouling | Gradual flow decline, rejection often holds initially | Natural organic matter, oils, humics in feed | High-pH alkaline clean (surfactant/EDTA blend) |
| Colloidal / particulate fouling | Fast pressure-drop rise at the lead element | Inadequate upstream filtration (SDI too high) | Alkaline clean; fix pretreatment root cause |
| Biofouling | Slow decline plus a biological/musty odor at cleaning | Residual chlorine gap allowing biofilm growth | Alkaline clean with biocide-compatible surfactant |
| Chlorine/oxidative damage | Rejection drops while flow may actually rise — not a classic fouling pattern | Free chlorine attacking the polyamide active layer over time | Not cleanable — damage is permanent; fix upstream dechlorination |
| Mechanical/physical defects | Localized rejection failure not tied to a flow trend | Glue-line folds or seal defects from manufacturing or handling | Not cleanable — requires element replacement, per 2025 aging-study autopsy findings |
| Mixed/combined fouling | Partial recovery after a single-chemistry clean | Two or more of the above occurring together (most common in the field) | Two-step clean: low-pH acid stage followed by high-pH alkaline stage |
⚠️ Important
But performance isn’t always clear-cut about what kind of fouling is the problem. Real-world systems often have a mixed load, so an acid wash followed by an alkaline wash can restore flow somewhat but not completely. Most field commission reports show the safest approach is to attempt a two-stage cleaning (low-pH then high-pH), not to guess based on the symptoms and just do one chemistry.
It’s also easy to interpret a temperature drop in flow as a sign that your membrane needs cleaning: permeate flow drops by a small percentage (a few %) for every degree that the feed temperature decreases. So be sure to normalize for temperature before you assume a membrane has fouled.
However, the membrane chemistry itself is steadily making ground on fouling, rather than just cleaning schedules. A 2024 patent application (WO2024154978A1) presents a novel RO membrane made with an amphipathic polyamide design intended for enhanced fouling resistance alongside improved wear resistance. This is just one of many recent efforts in membrane chemistry-which also include developments using hydrogels or zwitterionic surface coatings-aimed at prolonging the period between cleanings, rather than solely relying on the effectiveness of CIP washes after performance degradation has occurred.
How Long Do Low-Pressure Elements Actually Last? Lifecycle & Total Cost of Ownership
A low-pressure element typically lasts 2-3 years with correct pretreatment, but the “energy savings” number sales material leads with is only one part of the real operating cost, per the EPA’s Work Breakdown Structure cost model for RO/NF.
Below, the Membrane TCO Ledger breaks out the typical cost over a 3-year service period-because trying to make an element choice based on only purchase price and energy usage will usually lead you down the wrong path.
| TCO line item | What drives it | Where low-pressure elements win or lose |
|---|---|---|
| Pump energy | Applied pressure × run hours | Wins clearly on suitable (low-TDS) feed |
| Element replacement | Service life (typically 2–3 years) × unit cost | Roughly comparable to standard elements when pretreatment is correct |
| Cleaning chemicals & labor | Fouling frequency × CIP cost per event | Can lose here — less pressure margin means fouling shows up sooner if pretreatment slips |
| Capex (pump/ERD sizing) | Pump and energy-recovery device rating needed | Wins — lower pressure rating can allow a smaller pump and simpler system |
Most people purchasing low-pressure elements want to know about membrane life expectancy, and the answer is a bit more complex than a simple number.
A 2025 peer-reviewed study published in Separation and Purification Technology adds an interesting, almost counter-intuitive point to the “replacement cost” side of the ledger. Researchers tracked naturally aged low-pressure ro membranes against new elements, and found that permeability had increased with aging, but salt rejection had decreased. That’s the exact opposite of the uniform decline a simple “membranes get old the same way” prediction might imply.
Moreover, even within the same membrane module, there were differences: coupons from the beginning of the spiral wound suffered more performance loss than those at the tail, likely due to increased mechanical stress at the feed end. Virus and microplastic rejection stayed complete on almost every tested coupon, whether aged or not; in reality, the researchers determined the primary mode of failure for these aged low-pressure ro membranes was physical membrane flaws such as folds or glued areas that allowed contaminants to slip through the membrane, rather than inherent aging of the membrane film itself.
“The practical implication for operators is straightforward: a membrane that still tests within spec on rejection and flow is telling you more about its real remaining life than its calendar age is.”
For the practical buyer, this means that a strict, uniform “replace every 2-3 years regardless of performance” policy may be a mischaracterization of actual remaining membrane life.
Instead, monitoring trends in normal permeate flow and salt passage (data that’s already being collected for the fouling analysis) can offer a more accurate warning signal that the real life of an element is approaching its end, before calendar age would suggest it should be retired.
Test Conditions & Standards – Why Manufacturer Datasheets Don’t Match
Two low pressure ro membrane element datasheets, whether it’s a 4040 ro membrane or an 8040 commercial ro membrane, may appear identical on paper but have vastly different headline figures – one is 99.5% rejection at 2000 ppm NaCl, the other at 1,500 ppm for example. Both are valid because element-level performance testing and system-level certification are two different benchmarks answering two very different questions and purchasing can often mix the two.
ASTM D4194 (“Standard Test Methods for Operating Characteristics of Reverse Osmosis and Nanofiltration Devices”) is the device/element level methodology-it states how flux and rejection shall be tested but relies on the element manufacturer to choose the test salinity, pressure and recovery point on which to report data. This is why one element manufacturer’s reported value under a 1,500 ppm basis may be different from a competitor’s based on a 2,000 ppm basis-both figures are still consistent with ASTM test methods. NSF/ANSI 58, on the other hand, is a distinct system level standard-it provides certification of finished point-of-use or point-of-entry drinking-water RO systems to achieve specific contaminant-reduction performance goals.
A system manufacturer’s system certification according to NSF/ANSI 58, or a supplier’s individual element performance on an ASTM basis, do not directly correlate or serve the same purpose-and can be confusing for those in search of RO and nanofiltration elements.
📐 Engineering Note — normalizing two datasheets
So if we were to compare Element A (99.5% at 2,000 ppm at 150 psi) to Element B (99.6% at 1,500 ppm at 150 psi) on a level playing field, then we know that the rejection is going to be going up the lower that test concentration goes, for the same membrane chemistry so part of Element B’s number reflects that it had an easier test point. Get both datasheets’ full test parameters (salinity, pressure, recovery, and temperature) first, then either normalize both to a similar salinity using the manufacturer’s published rejection-vs-TDS curve, or request a side-by-side test on your actual feed water, the only comparison that removes the test-basis variable entirely.
Housing Formats & Retrofit Compatibility – What “4040” and “8040” Actually Mean
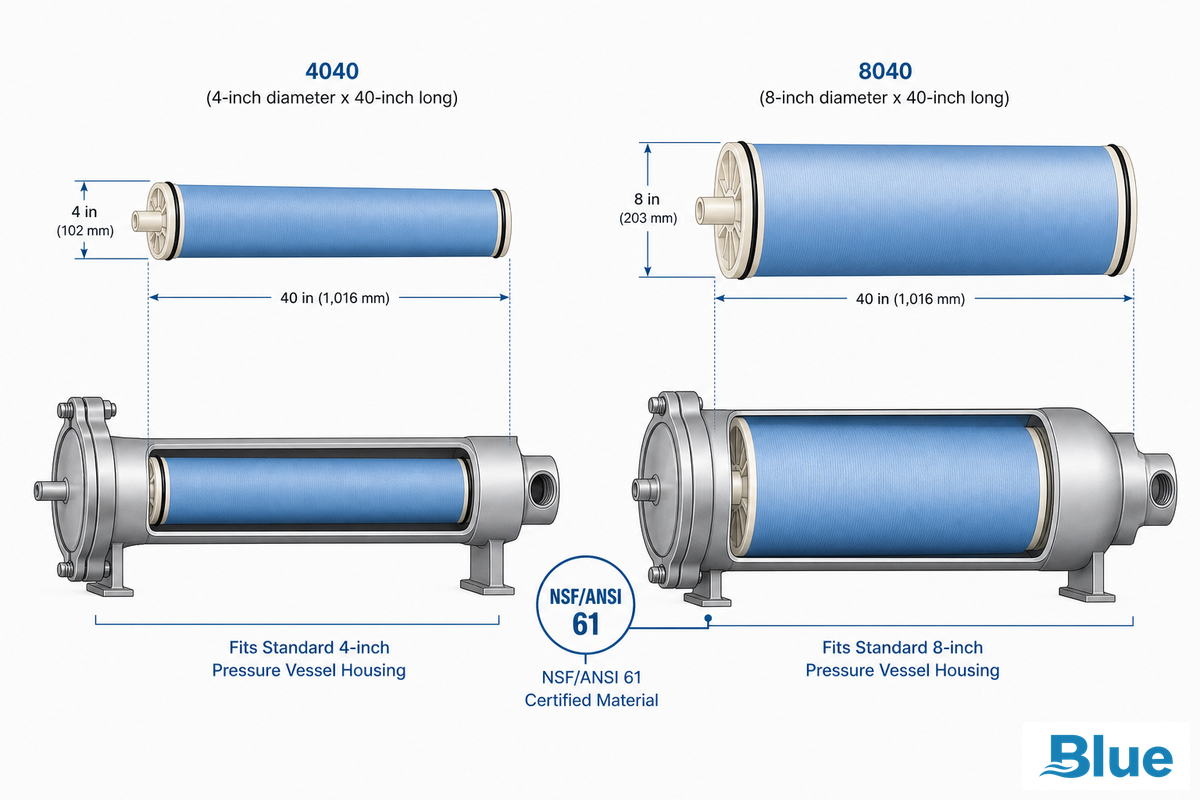
Element size codes only relate to physical sizes, not performance, e.g. 4040 = 4-inch diameter 40-inch long, 8040 = 8-inch diameter 40-inch long; both 40-inch element lengths fit standard 4- and 8-inch pressure vessels from all suppliers, to all pressure classes. Other smaller sizes (2540, 2521) are used on pilot systems and skid mounted systems. The size naming itself is industry convention rather than a codified dimensional standard — the EPA’s own Membrane Filtration Guidance Manual covers element and housing configuration without mandating a single naming scheme — but the housing and any wetted materials should still carry NSF/ANSI 61 certification (Drinking Water System Components — Health Effects) whenever the permeate is destined for potable or food-contact use, and any retrofit swap should be checked against the original system’s water quality requirements before assuming a higher-flux replacement element is a drop-in upgrade.
- Verify housing diameter and length corresponds to replacement element listing size
- Check the spacer thickness (typical is 28-34 mil) – smaller spacer can increase active area but also increase fouling on high-silt feed.
- Confirm o-ring / coupler sealing (not just o-ring dimensions) when putting a foreign manufacturer’s element into a housing element
- Make sure your flow rate and active area are matching your required permeate output – just the same product code won’t ensure same rated flow by brand
Retrofit capability across brands is a real, common need – most low-pressure and standard-pressure reverse osmosis membrane elements from different manufacturers share these format conventions, and membrane housings specifically, so systems aren’t locked to one supplier. For a specific brand-to-brand cross-reference (matching an installed competitor element to an equivalent replacement model, spacer, and test-basis comparison), see our C1/C2 low-pressure element datasheet and cross-reference chart.
System Design – Staging, Arrays & Pretreatment Trains for Low-Pressure Systems
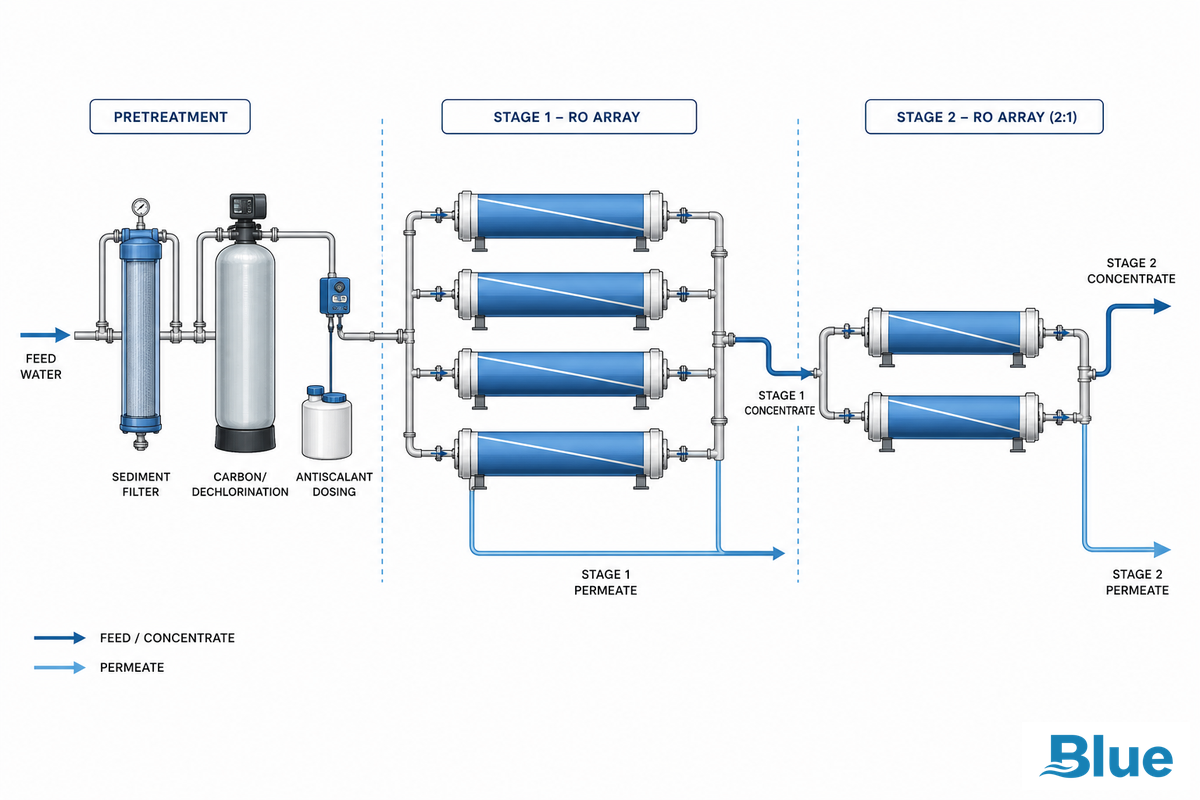
Element-level specs only describe one component; a working system stages multiple elements and gives them clean enough feed water to survive on. Single-element systems suit pilot and small commercial duty; larger systems array elements in multi-stage configurations (commonly a 2:1 or 3:2 array) so concentrate from the first stage becomes feed for the next, holding recovery and crossflow velocity in an efficient range across the whole train rather than overloading a single element — the same staged-array logic EPA’s ICR Manual for pilot-scale treatment studies uses to characterize fouling and pretreatment needs.
Pretreatment is where low-pressure systems most often fail in the field, whether the water source is municipal supply, well water, or reclaimed wastewater treatment effluent – and it’s not a minor footnote. Trade-press analysis of RO system design failures identifies inadequate feed-water pretreatment as the single most common cause of complete system failure, ahead of membrane chemistry or element selection issues. Industrial wastewater reuse feeds carry the heaviest impurity and dissolved-substances load of any source in this list, which is why array design and pretreatment depth matter more there than on clean municipal feed. Building a defensible minimum pretreatment train for a low-pressure system that reliably delivers clean water and stable recovery rate means including:
- Sediment filtration to 5 microns minimum (finer on surface or reuse-sourced feed)
- Activated carbon or sodium metabisulfite dechlorination to below 0.1 ppm free chlorine (polyamide membranes are chlorine-sensitive)
- Antiscalant dosing where hardness or silica scaling risk is present
- Ultrafiltration ahead of the RO stage on surface water or wastewater-reuse feed, where particulate/colloidal load is highest
A municipal case documented in industry trade press illustrates the payoff of getting this right at scale: a Riverside County, California desalination project specified two 2.25-million-gallon-per-day low-pressure RO trains with a properly engineered pretreatment stage ahead of them – the kind of system-level design decision that determines whether the pressure-class energy advantage actually survives contact with real feed water over years of operation, not just in a commissioning test.
Industry Outlook – What’s Changing in Low-Pressure Membrane Technology

Here’s the most consequential near-term shift: not a new pressure class, but how operators decide when to replace an element. That 2025 aging research is pushing replacement decisions away from a fixed 2-3-year calendar interval and toward condition-based monitoring: tracking normalized permeate flow and salt-passage trend over time to catch the point where an individual element’s real performance, not its age, says it needs replacing. For anyone specifying or maintaining a system heading into 2026, that means budgeting for basic trend logging (flow, pressure, conductivity) rather than treating replacement as a purely calendar-driven procurement line.
On the chemistry side, fouling-resistant membrane patents filed in 2024 (amphipathic polyamide, hydrogel coating, and similar approaches) indicate ongoing R&D into cleaning-interval extension rather than simply managing the problem as a downstream maintenance issue-the mark of a moving technology, not a mature product commodity. Regulatory standards are a moving target too: the NSF/ANSI 58 point-of-use RO standard has a new 2025 revision, and the EPA’s WaterSense stakeholder document shows the task group considering further updates to water-efficiency requirements (be careful which standard version your system integrator’s system-level certification references).
Third-party market-research vendors produce estimates that vary wildly-those figures should be treated with as much skepticism as any promotional market forecast: One market-research vendor estimates the U.S. ultra-low pressure ro membrane market to be about $0.6-$1.0 billion over 2024-2033; another places the overall U.S. ro membrane market at about $1.3-$3.0 billion over 2025-2035. Treat both as vendor-generated, U.S.-centric, directional guides of investment direction, not verified numbers, global totals, or replacements for engineering analysis.
FAQ – Low-Pressure & ULP RO Membrane Elements
Q: What is the minimum feed pressure a low-pressure or ULP element actually needs?
View Answer
Depends on the feed TDS; the element must exceed the osmotic pressure before any ro membrane begins to flow at all. For a low-TDS feed, a low-pressure element might have a 100-150-psi test basis, but your net driving pressure will be your applied pressure less about 1 psi per 100 ppm of TDS in the feed-so a 1,500-ppm feed would impose a back-pressure of about 15 psi from osmotic effects. Actual flux continues below test pressure on very low-TDS feed, but it’s best to size based on your actual worst-case feed and flow rate rather than a headline minimum flow; operating close to the osmotic limit impacts both flow and rejection.
Q: What’s the real difference between low-pressure and standard RO membranes?
View Answer
A low-pressure element employs a thinner, more permeable active layer designed to achieve acceptable rejection with a lower net driving pressure-and that’s the source of the energy savings. In contrast, a high-pressure (or “standard”) element typically uses a denser active layer designed to maintain rejection under higher and more fluctuating TDS. That choice is based on the feed-water characteristics-not on which element quality is higher. Using a high-pressure element on a genuinely low-TDS feed is simply a waste of pump energy it doesn’t need to expend.
Q: How do I know if my feed water is a good fit for a low-pressure element?
View Answer
You should consider three criteria for a low-pressure element to work efficiently: your feed TDS should be below about 2,000 ppm; SDI15 should be less than 5 (ideally under 3 if your surface or reuse-based feed has been pre-filtered by UF); and you’ll need to bring your free chlorine levels below 0.1 ppm prior to the ro membrane, as its polyamide active layer is susceptible to damage from free chlorine. If your feed meets those three requirements, a low-pressure or ULP ro membrane element will very likely prove to be an energy-efficient solution.
Q: Can I retrofit a low-pressure element into an existing standard-pressure housing?
View Answer
Usually yes (format 4040/8040 is identical for all pressure classes), but double-check O-ring and coupling compatibility, and always verify that the existing pump is capable of being operated effectively at lower pressure ranges. (For example, a pump sized for typical 200-psi standard-duty operation would require controls adjustment to operate efficiently at 100-150 psi).
Q: What’s the most common cause of premature fouling in low-pressure systems?
View Answer
Pretreatment deficiency is #1 in RO system failure analysis reports and is even more of an issue with low-pressure than with standard elements due to lower upfront spare driving pressure to buffer initial fouling. Two big areas: a lack of sufficient upstream filtration (when dealing with surface/reuse water fed to the membrane) allowing too many particles to hit it, and insufficient free chlorine removal that degrades the polyamide active layer over time. Fixing either one is a pretreatment train modification, not a membrane element choice change.
Q: Do low-pressure elements need different pretreatment than standard elements?
View Answer
Not different in kind, just in consequence – in terms of pretreatment categories that need to be addressed (sediment removal, dechlorination, antiscalant feed), the need is identical for both pressure classes, but a low-pressure element’s narrow margin of driving pressure means the symptoms of those pretreatment lapses appear more rapidly than with a standard element.
Working through a low-pressure or ULP element spec for a real feed-water application?
If the engineering above answered your “how” and “why,” and you’re now comparing low pressure ro membrane manufacturers, checking low pressure ro membrane price points, or weighing low pressure ro membrane cost against a specific feed-water spec, the next step is a real datasheet, not another explainer.
Our Perspective
This guide exists to fill a specific, recurring gap we’ve observed: many of the available explanations of low-pressure/ULP ro membranes only discuss the lower-pressure/same-flow aspects and don’t explore how to troubleshoot fouling, how life-cycle economics factor in, or why datasheets can vary. Because Blue Membrane produces low-pressure/ULP RO elements, we have an incentive for customers to understand the pressure class accurately, but the technical information presented (ASTM/NSF standards, fouling chemistry, membrane aging research from 2025) is applicable regardless of which supplier you’re looking at. Reviewed by the Blue Membrane technical team.
References & Sources
- Fouling in Reverse Osmosis Membranes: Monitoring, Characterization, Control – National Institutes of Health / PMC
- Investigating the Impact of Low-Pressure Reverse Osmosis Membrane Aging and Heterogeneity on Performance – Taligrot et al., Separation and Purification Technology (2025), open access
- ASTM D4194 – Standard Test Methods for Operating Characteristics of Reverse Osmosis and Nanofiltration Devices – ASTM International
- NSF/ANSI 58: Reverse Osmosis Drinking Water Treatment Systems – NSF International
- WaterSense Point-of-Use Reverse Osmosis Systems Stakeholder Meeting Documentation – U.S. Environmental Protection Agency
- Work Breakdown Structure-Based Cost Model for Reverse Osmosis/Nanofiltration Treatment – U.S. Environmental Protection Agency
- WO2024154978A1 – Amphipathic Polyamide-Based Reverse Osmosis Membrane – WIPO/Google Patents (2024)
- NSF/ANSI 61: Drinking Water System Components – Health Effects – NSF International
- Drinking Water Treatment: Reverse Osmosis – University of Nebraska-Lincoln Digital Commons
- Drinking Water Treatment: Reverse Osmosis (Extension Publication) – University of Nebraska-Lincoln Extension
- Reverse Osmosis Optimization – U.S. Department of Energy
- Membrane Filtration Guidance Manual – U.S. Environmental Protection Agency
- ICR Manual for Bench and Pilot-Scale Treatment Studies – U.S. Environmental Protection Agency
- Toray Releases Reverse Osmosis Membrane Elements That Double Ultrapure Water From Recycled Wastewater – Water Online
- Common Mistakes in Design, Use of Reverse Osmosis Systems – Ethanol Producer Magazine