Get in touch with Blue Membrane Company

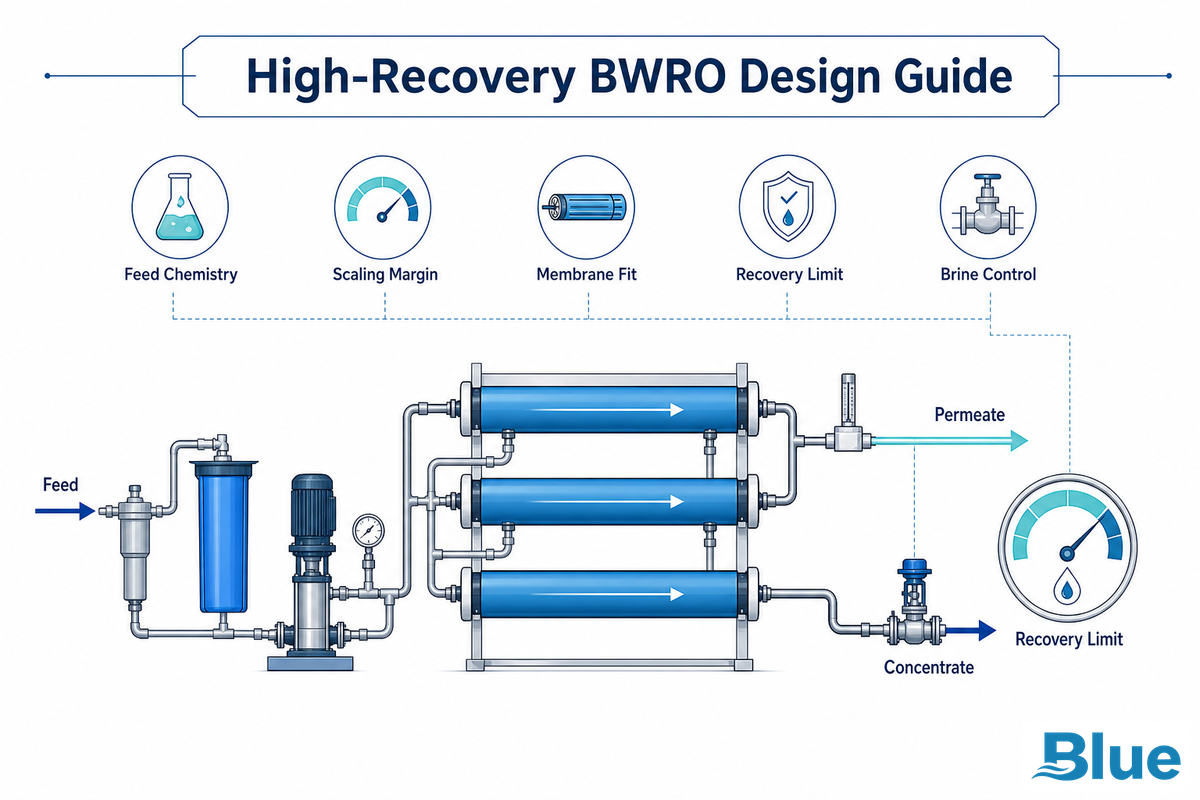
High-Recovery BWRO Design is the decision process for brackish water reverse osmosis systems where recovery, permeate quality, scaling margin, pressure, energy consumption, and concentrate handling all have to agree before the design target is safe. It is not a single recovery percentage or a membrane model picked from a catalog.
This guide is written for engineers, integrators, OEM buyers, and system owners who need a clear way to judge whether higher recovery makes sense. It intentionally stays educational. Blue Membrane already has a dedicated solution page for high-recovery project support; this article explains the checks a buyer should finish before that design conversation starts.
What High-Recovery BWRO Design Means in Brackish Water Reverse Osmosis
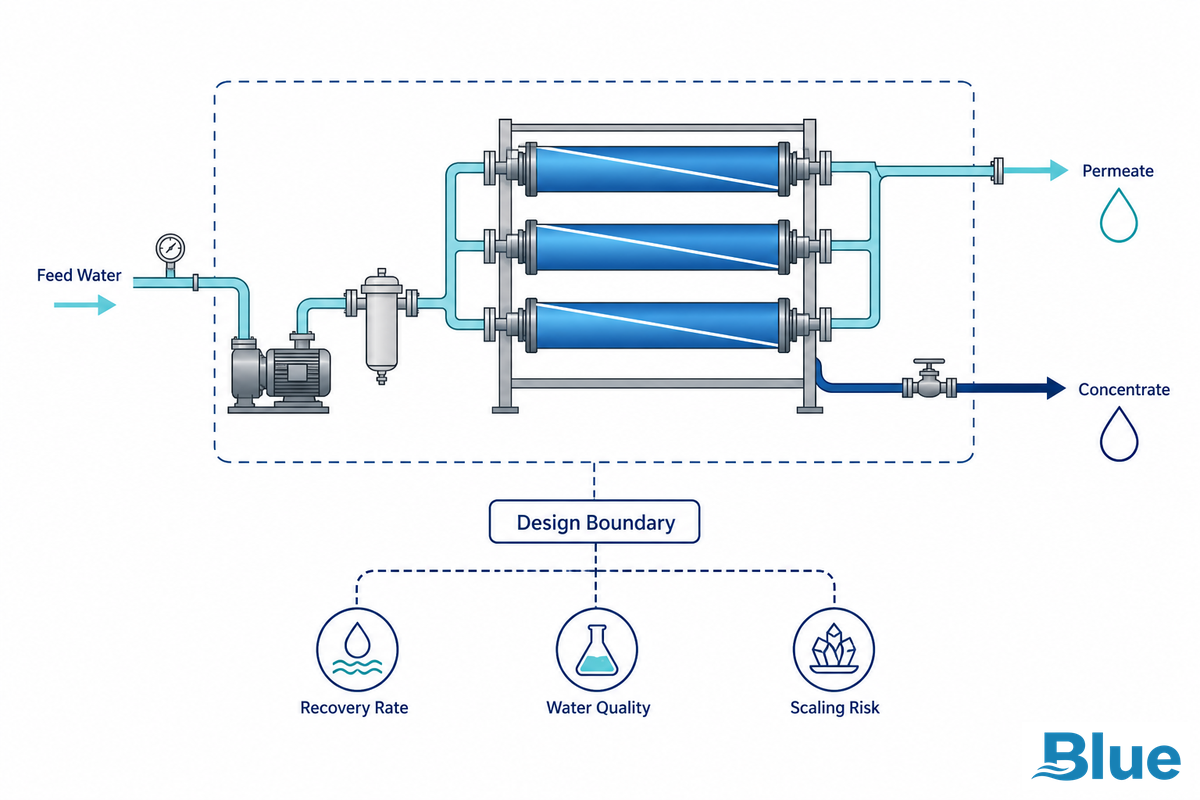
Brackish water reverse osmosis, often shortened to BWRO, treats feed water with lower salinity than seawater but more dissolved solids than typical fresh water. In a RO system, feed water is split into permeate and concentrate. The recovery rate is the share of feed water converted into product water. Overall system recovery can change when staging, concentrate recycling, batch operation, or a second pass is added.
High recovery therefore means more than increasing one setting. It means selecting a recovery target that fits feed-water chemistry, membrane behavior, pretreatment, final water quality, and the concentrate route. A 2025 OSTI-indexed study on reverse osmosis concentrate treatment frames recovery as tied to scaling control and concentrate-volume reduction, not as a standalone goal. OSTI recovery and scaling study
Specification language can blur the boundary. A project may be called a BWRO plant, a brackish water desalination plant, a high-recovery brackish water desalination project, or a reverse osmosis desalination upgrade. The label does not change the design approach. The design of reverse osmosis for industrial water treatment still depends on water flow, high pressure limits, high permeate quality, high salt rejection, brine recovery, desired recovery, design and operation rules, total cost of water, and system performance. In industrial water or water scarcity projects, higher recovery rates and high recovery rates only help when the reverse osmosis process, conventional RO baseline, and any seawater reverse osmosis comparison stay separate from the desalination of brackish water. If a tender uses the phrase “recovery reverse osmosis,” treat it as shorthand for recovery-led RO design, not a new membrane category. These are design considerations, not a shortcut around chemistry. A source-bounded paper model at 80% recovery and 4000 ppm feed is not the same design case as a field plant with a different pressure envelope.
Design review note: the risk is not the 80% recovery target by itself; the risk appears because a water plant application may treat a paper number as a fixed limit. Blue Membrane provides precision membrane manufacturing, but the recovery target still has to follow real feed-water data.
Recovery Rate, Water Recovery, and Risk Tradeoffs
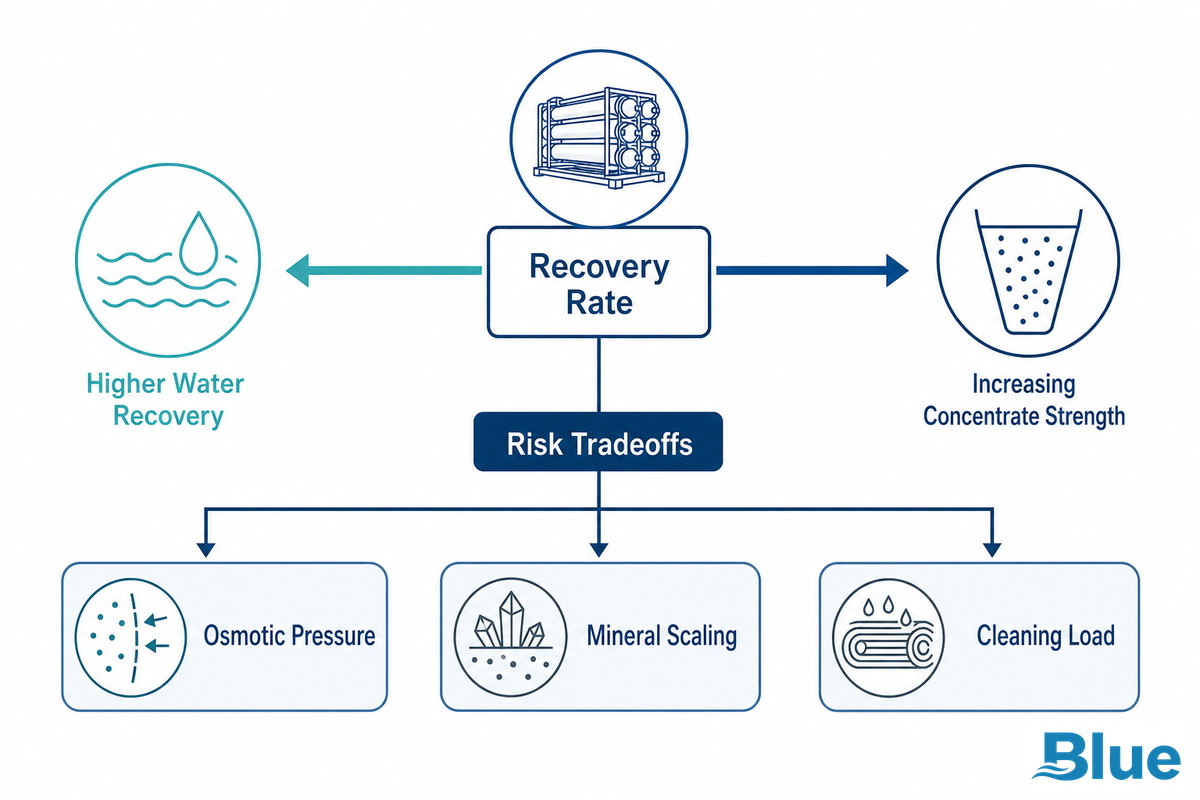
Higher recovery can reduce raw-water demand, increase water production, and lower the volume of brine that must be handled. Those are real benefits in water-scarce sites or plants with costly discharge. The tradeoff is concentration factor. As recovery rises, salts and sparingly soluble species remain in a smaller concentrate stream. That can raise scaling, fouling, chemical demand, cleaning frequency, feed pressure, and operating cost.
Project note: the risk becomes expensive because an OEM or water plant application can save intake water and still fail the brine route. Blue Membrane provides precision membrane options, but the better decision starts with the tradeoff that controls the next 1% recovery step.
The better question isn’t whether high recovery is good. The better question is what controls the next percentage point of recovery. Sometimes the limit is calcium carbonate or sulfate scale. Sometimes it’s silica. Sometimes it’s energy, product-water stability, or the discharge permit. In low-TDS brackish water desalination, a low feed salinity case may require electrodialysis or hybrid RO/ED comparison instead of forcing an RO-only answer. Brackish water electrodialysis research
The Recovery Ceiling Test
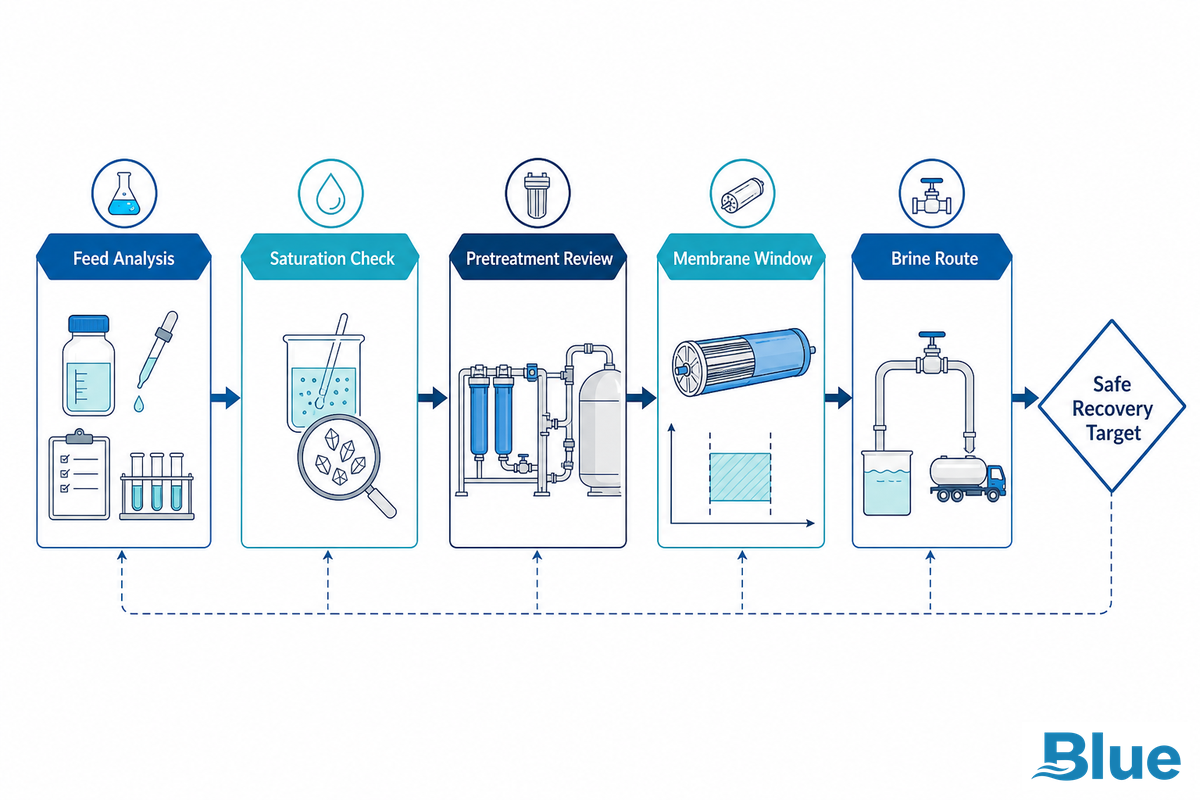
The Recovery Ceiling Test is a nine-point check that asks what will break first if the recovery target is pushed higher. It’s useful before equipment sizing because it separates a realistic high recovery target from a sales number and keeps the review tied to source-backed recovery limits, including the OSTI recovery and scaling study.
| Checkpoint | Why it matters | Evidence needed | Design response |
|---|---|---|---|
| Feed TDS | Sets osmotic pressure and concentration factor. | Recent lab analysis in mg/L. | Set the first pressure and recovery window. |
| Calcium hardness | Drives carbonate and sulfate scale risk. | Calcium, magnesium, hardness. | Adjust pretreatment or recovery target. |
| Alkalinity | Affects carbonate saturation. | Alkalinity and pH. | Check acid or antiscalant strategy. |
| Silica | Often limits brackish recovery. | Silica concentration and pH. | Avoid fixed high-recovery claims without modeling. |
| Sulfate | Links to gypsum, barite, and strontium scale. | Sulfate, barium, strontium. | Limit concentrate supersaturation. |
| Iron and manganese | Can foul membrane surfaces. | Metals data and oxidation state. | Add removal before the RO process. |
| Temperature | Changes flux and pressure needs. | Seasonal minimum and maximum. | Size with cold-water and warm-water margin. |
| Permeate quality | Defines rejection and pass count. | Product-water specification. | Choose single pass, two pass, or blending. |
| Concentrate route | Can be the project limit. | Discharge, reuse, injection, or disposal path. | Confirm whether higher recovery is worth pursuing. |
This test also needs a membrane-interface check. A 2024 arXiv paper on concentration polarization explains that the upstream layer near the membrane can reduce flux and increase solute leakage. Bulk feed-water chemistry and final concentrate chemistry are necessary, but they aren’t the whole design picture. Concentration polarization models
Feed-Water Chemistry: Data Needed Before Setting Recovery
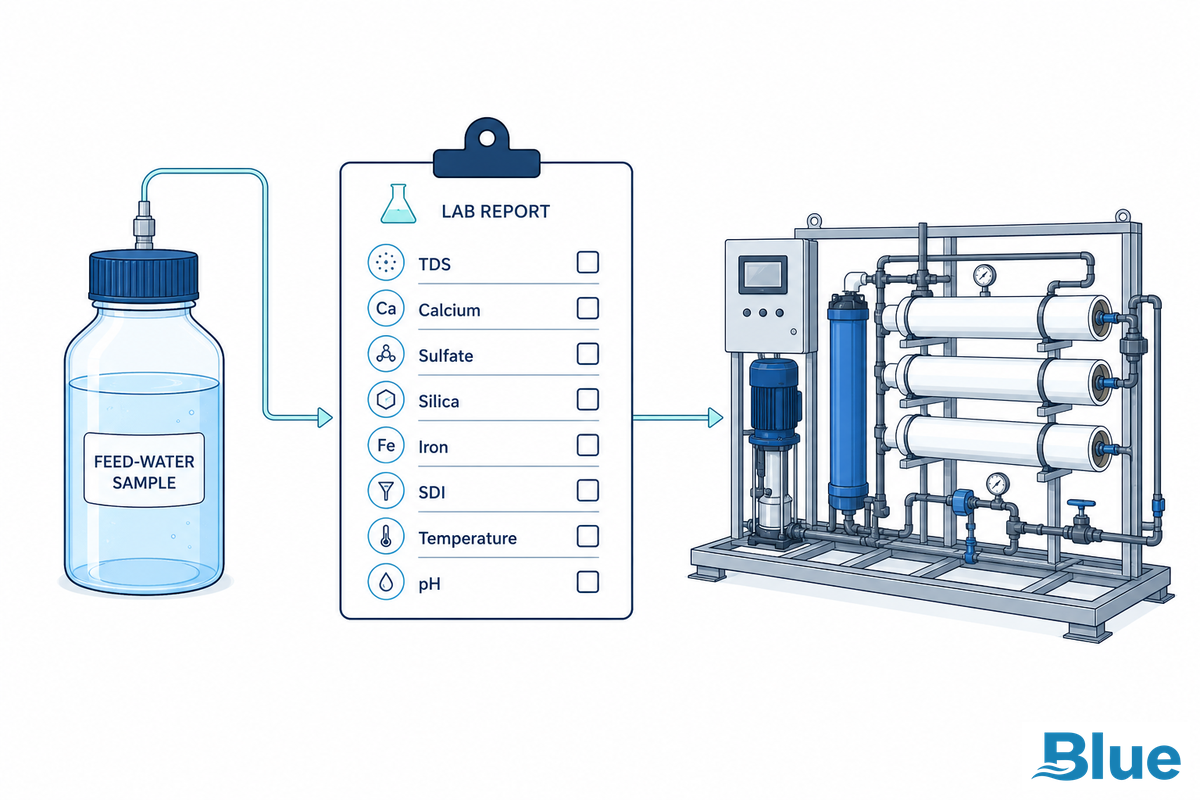
A high recovery target should begin with a complete raw-water package: TDS, major ions, hardness, alkalinity, silica, sulfate, chloride, iron, manganese, pH, temperature range, turbidity, SDI, organics where relevant, expected feed flow, target recovery, and target permeate quality. If the source changes seasonally, one sample isn’t enough.
Review note: the hidden risk is a data gap because a water plant application can look stable in one season and fail at 80% recovery in another. Blue Membrane provides precision membrane data, but the feed-water package has to come first.
TDS alone can’t prove that high recovery is safe. Two waters with similar TDS can behave differently if one has more silica, sulfate, hardness, organics, or iron. The OSTI study on concentrate treatment is a useful reminder: scaling control depends on hardness, silica, TDS, and pretreatment limits, not a single salinity number. Pretreatment and scaling evidence
Scaling Margin Ledger
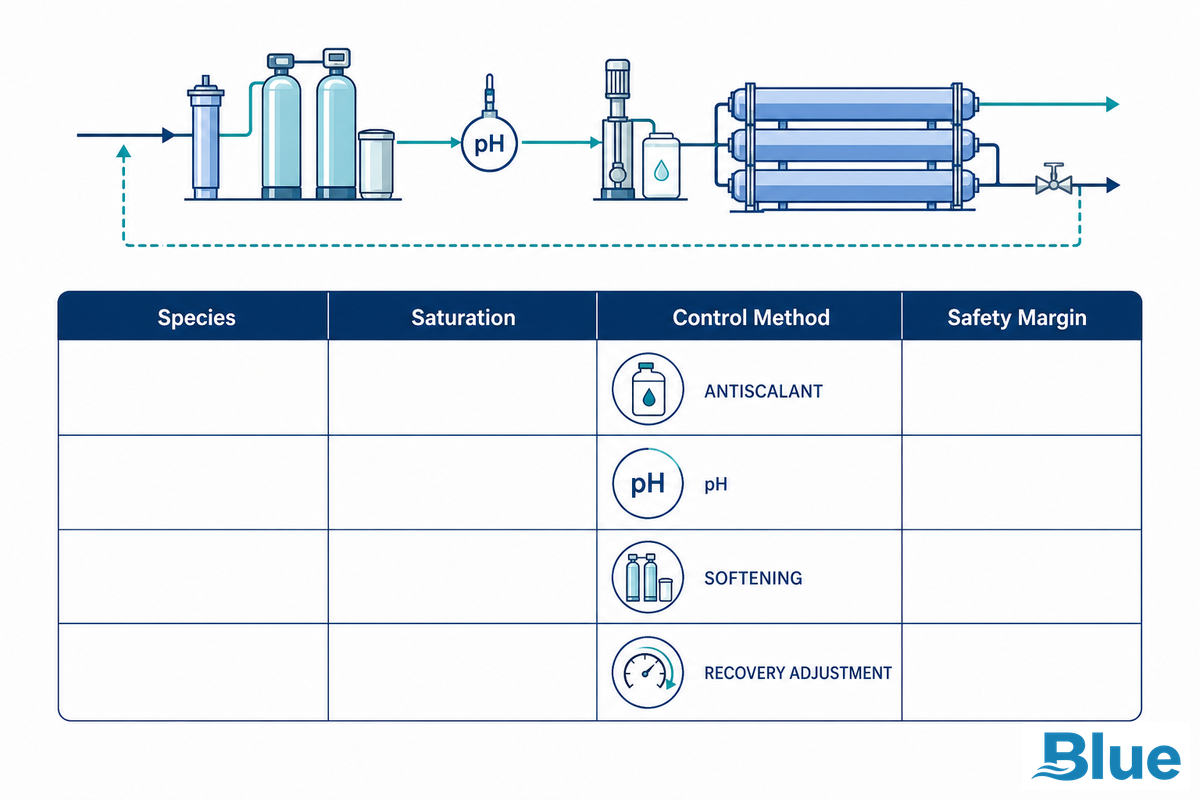
The Scaling Margin Ledger records which species are likely to set the practical ceiling. It’s a working table for design review, not a substitute for projection software or pilot testing. Keep the ledger tied to source-backed scaling evidence, such as the OSTI concentrate treatment study.
Design note: the trap is treating software output as proof because scaling risk can shift with pH, 4000 ppm feed, or antiscalant dose in the field. Blue Membrane provides precision membrane choices, but the ledger should still confirm the limit before the design moves forward.
| Ledger item | Risk signal | What to verify | Typical design action |
|---|---|---|---|
| Calcium carbonate | pH and alkalinity rise in concentrate. | LSI or projection result. | Acid, antiscalant, or lower recovery. |
| Calcium sulfate | Sulfate and calcium exceed margin. | Gypsum saturation. | Limit recovery or soften feed water. |
| Silica | Silica approaches unsafe concentration. | Silica and pH. | Add pretreatment or cap recovery. |
| Barium/strontium | Trace ions form low-solubility scales. | Trace metals analysis. | Projection with antiscalant limits. |
| Iron | Oxidation and particulate fouling. | Iron, ORP, pretreatment history. | Remove before membranes. |
| Organics | Flux loss and biological growth. | TOC, SDI, field history. | Improve filtration or cleaning plan. |
| Temperature | Seasonal flux and pressure swing. | Minimum and maximum water temperature. | Model both seasonal cases. |
| Concentration polarization | Local membrane surface salt is higher than bulk. | Flux, spacer, velocity, module design. | Adjust flux and staging. |
| Cleaning limit | Frequent cleaning erodes uptime. | CIP interval and chemical tolerance. | Lower flux or add pretreatment. |
In the OSTI-indexed 2025 study, activated alumina reached up to 65% silica reduction and a modeled secondary RO case indicated about 70% additional recovery after pretreatment with antiscalants. Those numbers are source-specific, but they show why the ledger belongs before the final recovery target.
Membrane Selection for High-Recovery BWRO
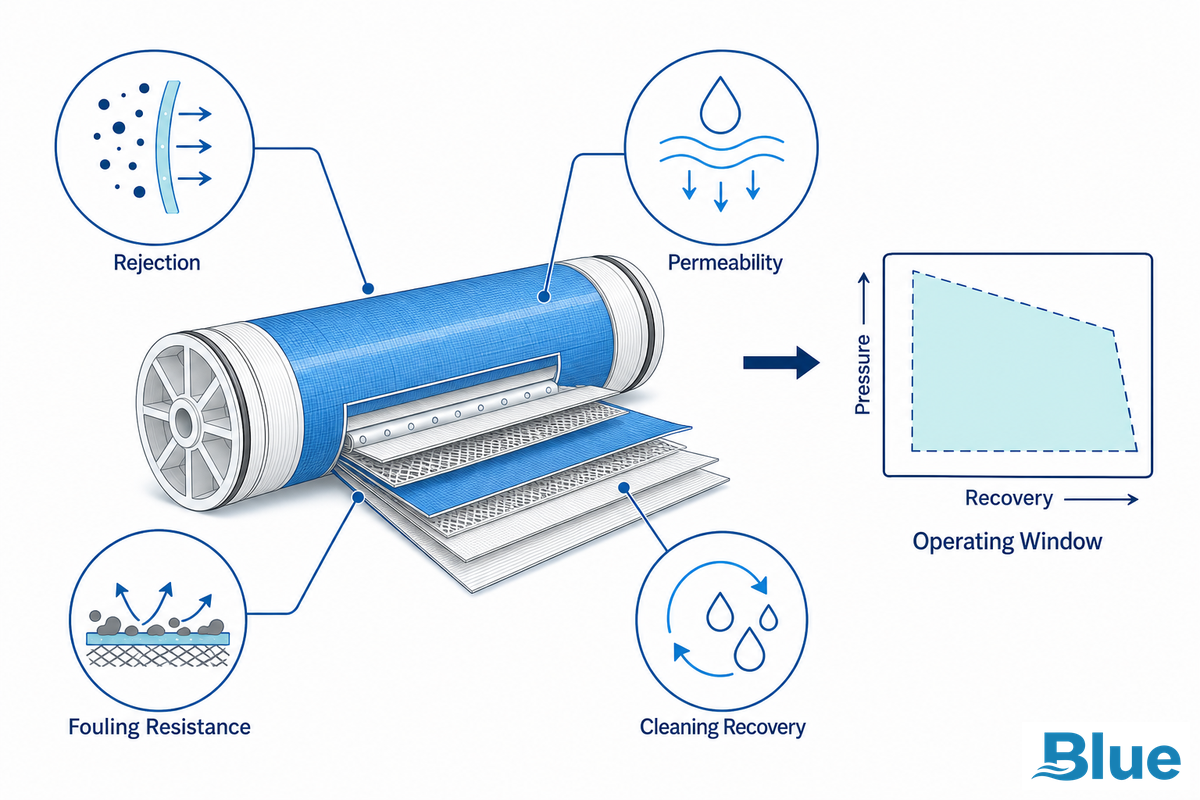
Membrane selection affects salt rejection, permeability, feed pressure, fouling resistance, cleaning tolerance, and permeate quality. A high-recovery BWRO system may need a different element choice than a low-pressure standard system because the last stage sees higher salinity and higher scaling stress.
Selection note: the risk is choosing an element before chemistry because the final-stage application may need high salt rejection at higher pressure. Blue Membrane provides precision membrane sheets and spiral wound elements, but the element choice still has to match the projected risk.
Blue Membrane manufactures reverse osmosis membrane sheets and spiral wound elements for industrial, municipal, commercial, and specialty water treatment. In a guide like this, the brand context should stay practical: stable membrane chemistry, strict quality control, high rejection, permeability, fouling resistance, and chemical-stress resistance are selection criteria to discuss with project data in hand. ISO 20466:2024 is not a high-recovery design standard, but it is a 2024 signal that recovered spiral-wound RO membrane performance grading is becoming more formal in water reuse contexts. ISO 20466:2024
Configuration Choices: Single-Stage, Multi-Stage, Two-Pass, Batch/Closed-Circuit RO, or Hybrid
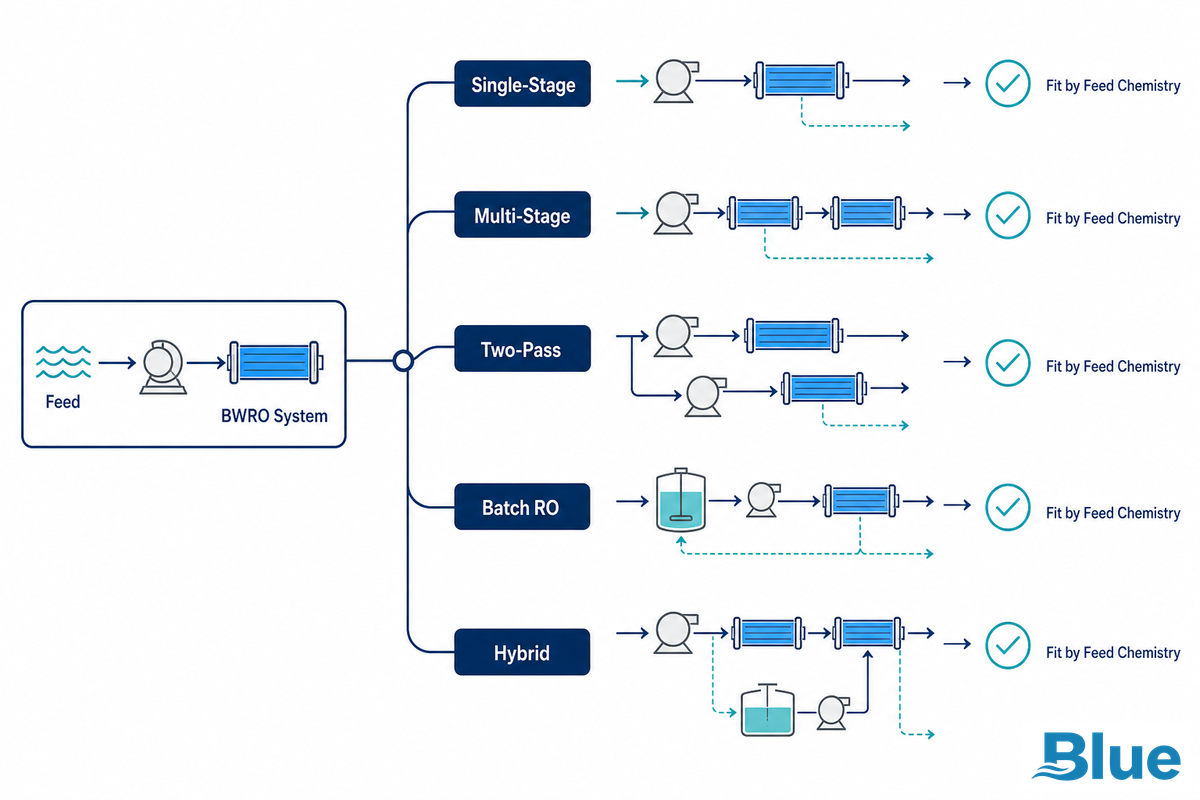
The Configuration Fork compares design paths by fit, not by declaring one universal winner. This keeps the guide separate from a solution page: the article teaches how to choose the branch; the solution page can handle project-specific sizing and membrane discussions.
Configuration note: the tradeoff matters because an OEM application can need simple operation while a water plant may accept more controls for higher recovery. Blue Membrane provides precision membrane support, but the configuration should be engineered to the pressure, cleaning, and brine-risk profile.
| Configuration | Best fit | Main risk | Evidence needed |
|---|---|---|---|
| Single-stage BWRO | Simple feed water and moderate recovery. | Lower recovery ceiling. | Basic water analysis and target flow. |
| Multi-stage BWRO | Higher recovery with staged concentrate treatment. | Last-stage scaling. | Projection for each stage. |
| Two-pass RO | Strict product-water quality. | More pressure and equipment. | Permeate quality target. |
| Concentrate-side RO | Existing RO upgrade. | High scaling load in second train. | Concentrate chemistry. |
| Batch RO | Flexible recovery control. | Control complexity. | Cycle model and valve strategy. |
| Closed-circuit RO | High recovery with controlled recirculation. | Monitoring and control burden. | Pressure, flux, and salt passage model. |
| RO plus softening | Hard brackish water. | Chemical sludge or regeneration cost. | Hardness and alkalinity balance. |
| RO plus electrodialysis | Low-TDS or selective-ion cases. | Technology boundary and controls. | RO/ED energy and recovery comparison. |
| Minimal or zero liquid discharge train | Strict concentrate route. | Capital cost and energy burden. | Disposal permit and brine chemistry. |
Google Patents US11884567B2 shows how brine concentration systems can combine multiple membrane steps, brine concentrators, pressure control, and alternative routing. Patents aren’t design instructions, but they show why configuration choice remains an active engineering topic. Desalination brine concentration patent
Energy, Pressure, and Cost Tradeoffs
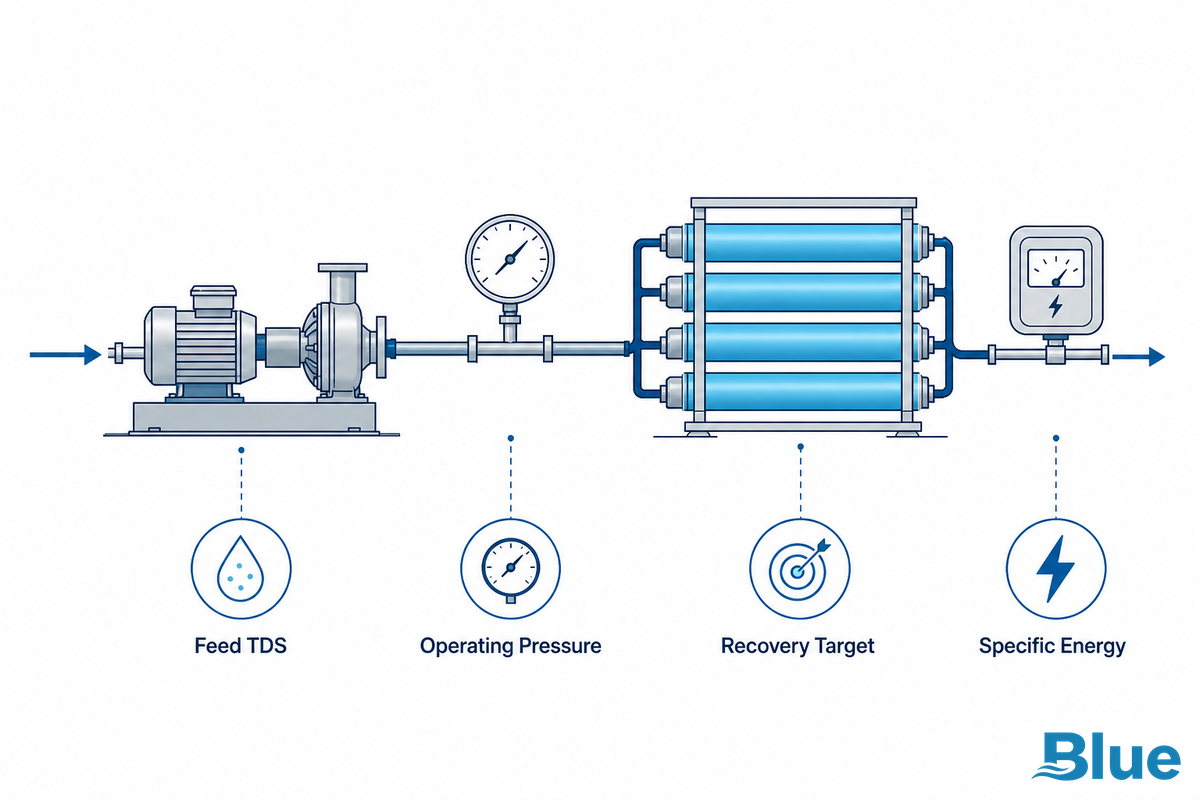
Higher recovery can lower intake water and brine volume, yet it can also increase feed pressure, chemical use, monitoring needs, cleaning cost, and brine-management complexity. A conventional RO baseline is still useful because it shows what changes when a project tries to increase recovery. A simple cost-per-cubic-meter claim is weak unless it includes pretreatment, membrane replacement, power, cleaning, downtime, concentrate handling, and post-treatment.
Cost note: the hidden risk is a narrow energy claim because 0.54 kWh/m3, 0.26 kWh/m3, and 0.17 kWh/m3 belong to a model, not every application. Blue Membrane provides precision membrane manufacturing, but the total cost of water still depends on the full operating case.
| Source-bounded number | What it can support | How to use it safely |
|---|---|---|
| 65% silica reduction | Pretreatment can change scaling margin. | Use only for the OSTI 2025 study context. |
| 800 bed volumes | Activated alumina run length in that study. | Do not turn it into a Blue Membrane operating promise. |
| About 70% additional recovery | Modeled secondary RO after IX/AA pretreatment. | State as modeled, not guaranteed. |
| 80% recovery | MDPI 2012 theoretical configuration comparison point. | Use as research context, not a universal target. |
| About 30% specific-energy reduction | Batch RO theoretical comparison in the MDPI 2012 article. | Keep the theoretical-limit qualifier. |
| 4000 ppm feed concentration | MDPI 2012 theoretical comparison example. | Use as a paper-specific model input. |
| 3000 mg/L low feed concentration | MDPI 2012 cites a low-concentration case where a 3-stage system with ERD was recommended. | Use as comparison context, not a Blue Membrane design limit. |
| 0.54 kWh/m3 SEC | MDPI 2012 reports a single-stage normalized SEC example at 80% recovery. | Keep the source and model assumptions visible. |
| 0.26 kWh/m3 SEC | MDPI 2012 reports a multi-stage system with energy-recovery device example. | Use only as a theoretical comparison value. |
| 0.17 kWh/m3 SEC | MDPI 2012 reports a batch-RO theoretical-limit example. | Do not convert it into a field guarantee. |
| 24 kWh/m3 | Patent background example for thermal brine concentration. | Use only as a patent example. |
| 15-25 kWh/m3 | Patent comparison range for conventional brine concentrators. | Do not apply to every plant. |
| 4.5 kWh/m3 | Patent example for a membrane brine concentrator case. | Keep patent-example wording. |
| 120 Bars | Patent discussion of membrane burst-pressure assumption. | Never use as a design limit without the membrane datasheet. |
The 2012 MDPI configuration comparison reported theoretical energy patterns for staged, energy-recovery, batch, and closed-circuit BWRO designs, including an 80% recovery comparison and about 30% further theoretical specific-energy reduction for batch RO in its modeled context. Treat it as a configuration lesson, not as a current vendor performance promise. Every project still needs its own feed chemistry, pressure, flux, membrane, cleaning, and concentrate-routing model. OSTI concentrate treatment study
Concentrate Control and Brine Management
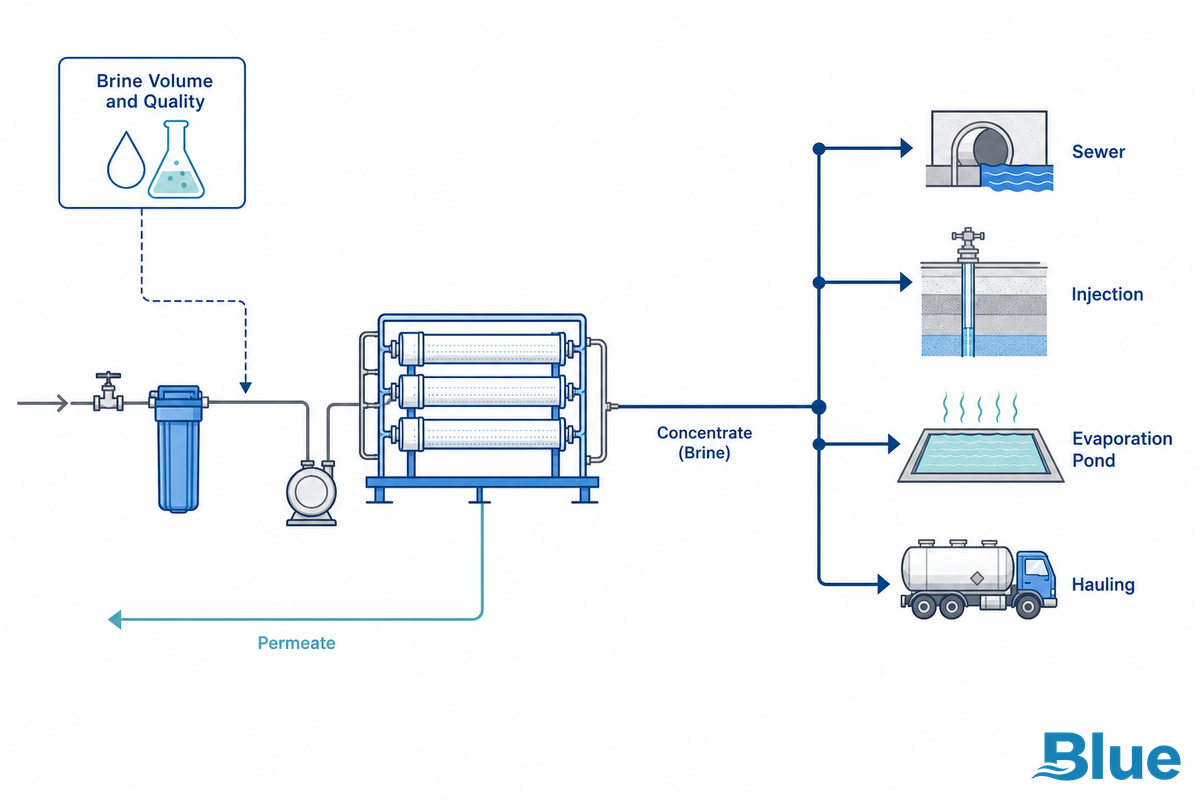
The Concentrate Disposal Reality Check asks where the concentrate will go. Options can include permitted discharge, sewer acceptance, blending, reuse, evaporation, deep-well injection, further brine concentration, or minimal/zero liquid discharge. Each path has cost, monitoring, and compliance effects.
Disposal note: the risk is a permitting gap because a water plant application can recover more water while moving cost into brine handling. Blue Membrane provides precision membrane support, but the concentrate route remains the limit if the permit, sewer acceptance, or disposal path is not ready.
This is often the point where higher recovery becomes a business decision rather than a membrane decision. EPA materials on injection wells note that brine can be among the injected fluids, while EPA permitting materials discuss concentrated residuals and RO concentrate in water reuse projects. A plant can’t treat the concentrate route as an afterthought if high recovery is part of the design target. EPA injection-well information
When to Move From Guide Reading to Design Support
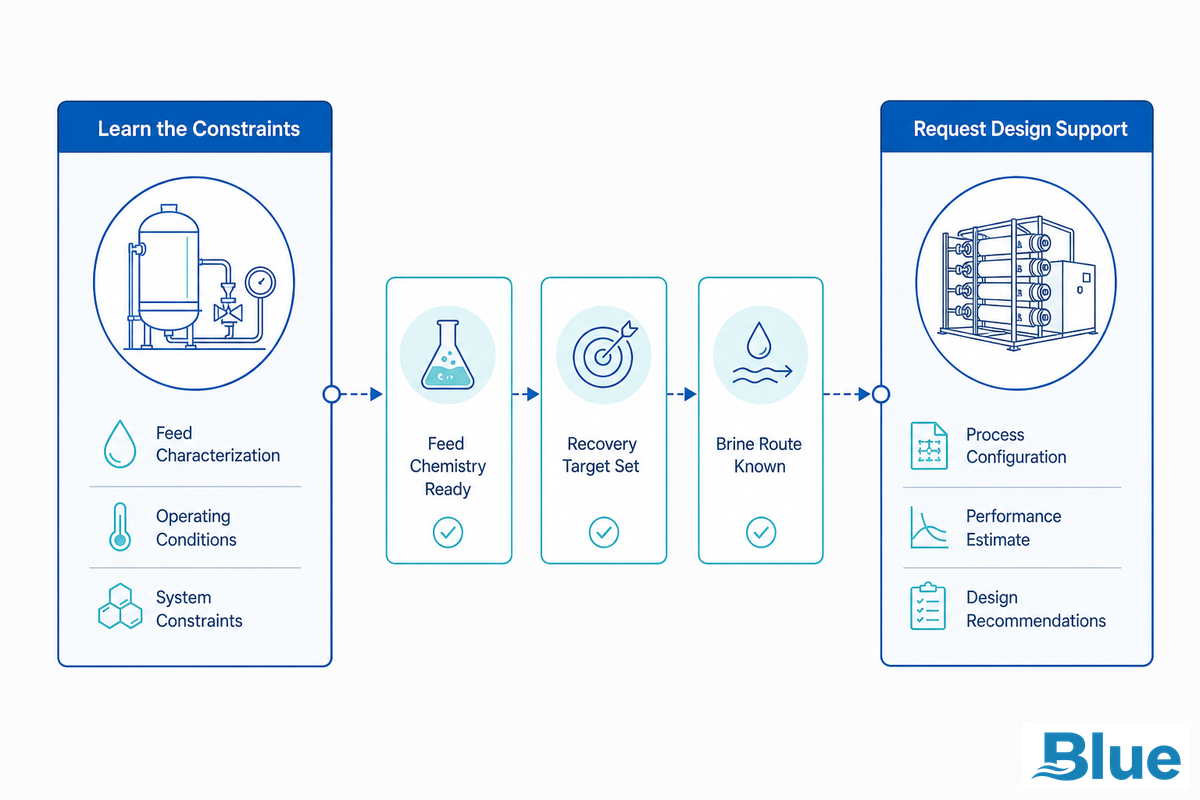
A project is ready for design support when the team has a recent water analysis, seasonal range, feed flow, target recovery, target product-water quality, existing pretreatment notes, pressure limits, cleaning expectations, and a defined concentrate route. If those inputs are missing, a design discussion will tend to become guesswork.
Handoff note: the risk is a rushed RFQ because an industrial buyer can ask for high recovery before the application, 80% recovery basis, and brine route are known. Blue Membrane provides precision membrane and system-design support when the evidence package is ready.
If your feed-water data and concentrate route are already defined, Blue Membrane’s design support for high-recovery brackish RO systems can help turn those limits into a membrane and system-design discussion. You can also review Blue Membrane’s RO membrane products and the guide on how to choose an RO membrane supplier before preparing project notes. For concentrate-heavy projects, keep the EPA permitting path visible from the start. EPA disposal-path context
2025-2026 Design Considerations to Watch
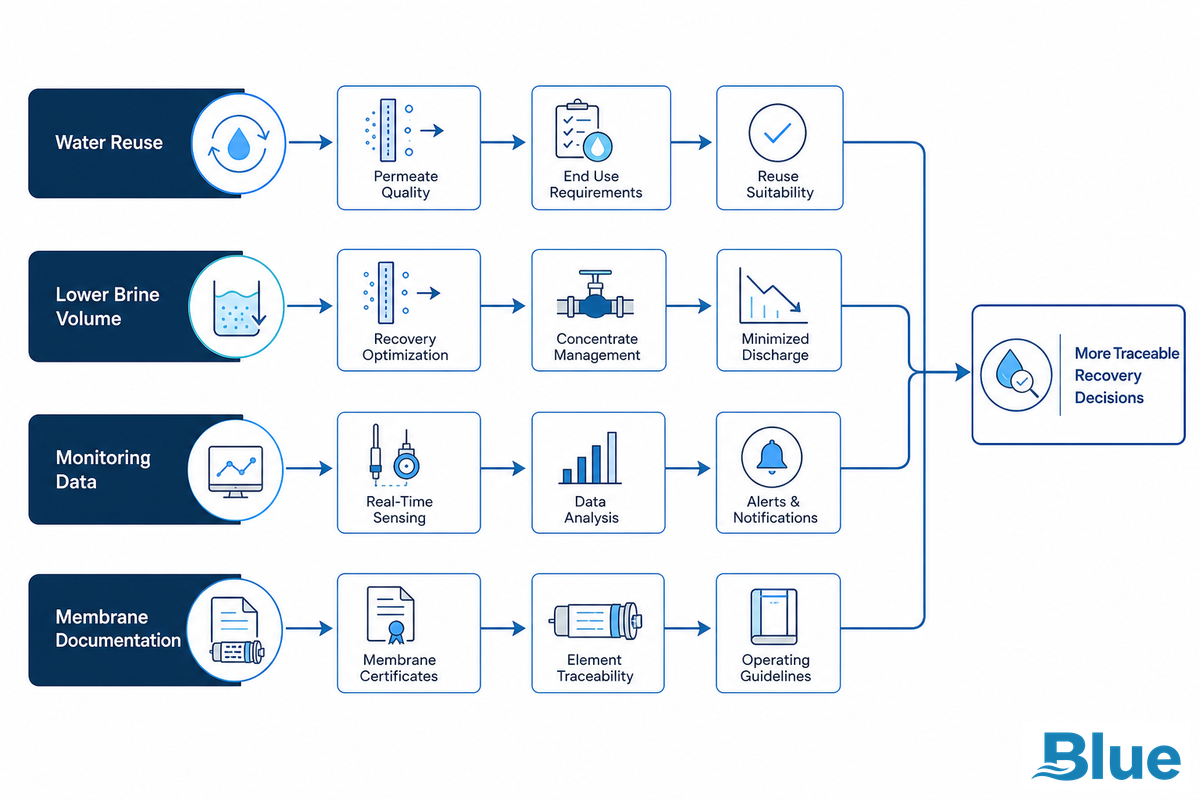
The safest trend language is cautious. Recent work points toward better pretreatment for silica and hardness, more interest in flexible RO configurations, closer attention to concentration polarization, and more formal membrane-performance grading for reuse applications. It also points toward more comparisons with electrodialysis or hybrid systems in low-TDS brackish cases.
Trend note: the risk is chasing a new configuration because a 2024 or 2025 signal may fit one application and fail another. Blue Membrane provides precision membrane products, but design and operation still need project data before a trend becomes a specification.
For Blue Membrane buyers, the practical signal is this: ask for a recovery target only after the design boundary is known. Membrane chemistry, element quality, pretreatment, controls, and concentrate route all shape whether high recovery is reasonable. ISO 20466:2024 and recent patent activity are useful signals, but they should not replace project-specific calculations. ISO 20466:2024 Google Patents record
FAQ
What is high-recovery BWRO design?
View Answer
High-recovery BWRO design is the process of setting a brackish water reverse osmosis system to recover more permeate while controlling scaling, fouling, pressure, energy consumption, concentrate quality, and product-water stability. It isn’t only a membrane choice. The recovery target must be checked against feed-water chemistry, pretreatment, permeate quality, brine handling, and the operating margin available in the final membrane stage.
What factors limit the recovery rate of a BWRO system?
View Answer
The main limits are feed-water salinity, hardness, alkalinity, silica, sulfate, iron, manganese, temperature, membrane selection, pretreatment, feed pressure, target permeate quality, concentration polarization, and concentrate disposal. As recovery rises, the remaining concentrate becomes more concentrated, so scaling and fouling risks can grow. A safe design starts with water analysis, not a fixed percentage. It also checks whether the final product water needs stabilization, blending, or another pass before it can serve the process.
Is high recovery always better for brackish water RO?
View Answer
No. Higher recovery can reduce brine volume and increase water production, but it can also raise scale risk, pressure demand, cleaning frequency, post-treatment needs, and disposal complexity. Choose it only when feed chemistry, membrane performance, pretreatment, and concentrate handling support the target. If the brine route or product-water stability is uncertain, a lower recovery design can be the better first engineering decision.
What feed-water data is needed before choosing a high-recovery design?
View Answer
Include TDS, major ions, hardness, alkalinity, silica, sulfate, chloride, iron, manganese, pH, temperature range, turbidity or SDI, organics where relevant, target flow, recovery target, and product-water quality. Also record seasonal variation and any existing pretreatment problems. This data lets engineers judge scaling margin, membrane fit, pressure needs, concentrate disposal risk, and whether a non-RO or hybrid comparison belongs in the study before choosing a configuration.
When should I contact a membrane supplier or design partner?
View Answer
Contact a supplier when water analysis, feed flow, product-water target, recovery goal, schedule, and concentrate route are ready.
Related Blue Membrane Resources
Use these resources when a water plant application still has a design gap, because membrane selection risk depends on pressure, chemistry, and project notes. Blue Membrane provides precision RO membrane guidance, not a fixed recovery percentage.