Get in touch with Blue Membrane Company

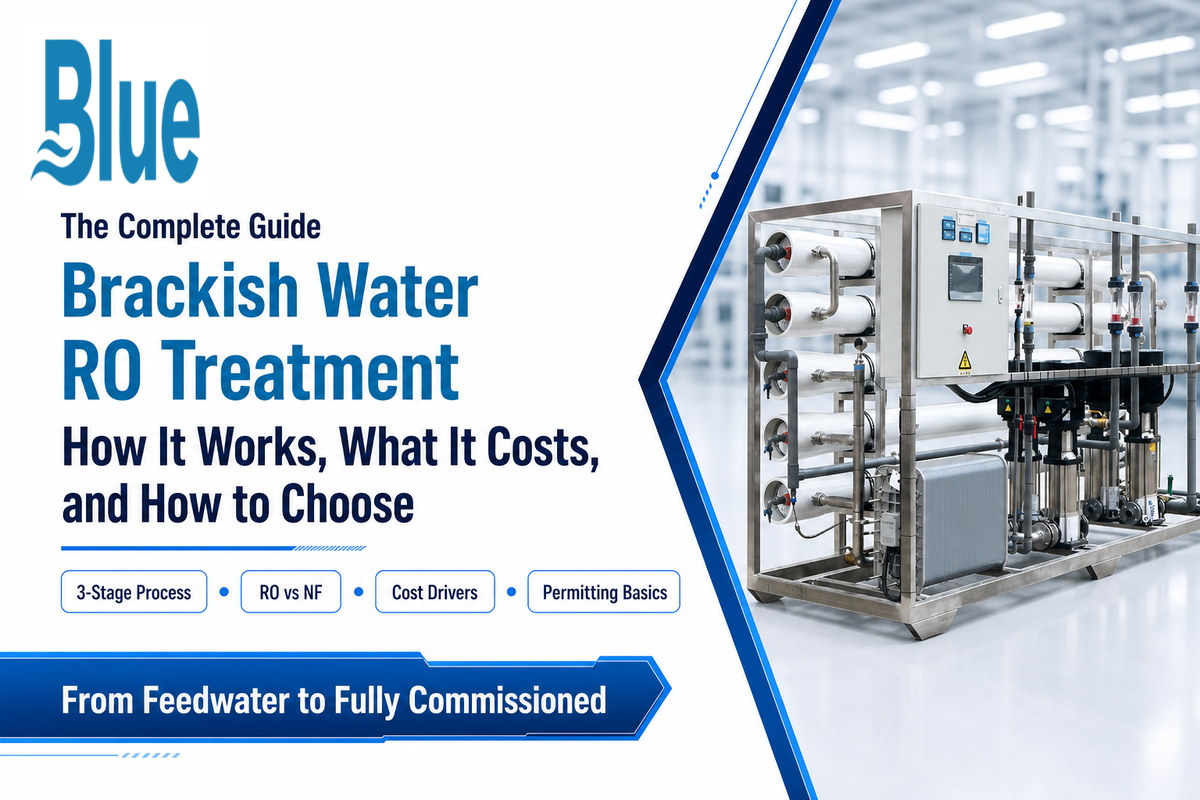
Brackish Water RO Solutions are reverse osmosis treatment systems that convert water too saline to drink or process into usable output — too saline for direct use, but not nearly as saline as seawater — by pumping it through a semi-permeable membrane under pressure. This guide covers that treatment as a whole system, not just a single filter: a pretreat stage, a central RO stage where the desalting occurs, and a post-treatment stage where the purified water is conditioned for its intended application. Here’s how that system actually works, where RO fits in the technology selection mix, the key cost drivers, and a common regulatory hurdle most buyers overlook.
Key Points
- brackish water covers a wide range-1,000-10,000 mg/L TDS-though sources disagree on the precise cutoff, which matters for equipment choice.
- Pushing for a higher recovery rate isn’t automatically the way to a lower total cost-it often drives higher energy costs, even where scaling is less of a concern.
- Concentrate management is a separate regulatory pathway from system design approvals; most buyers prepare for just one of the two.
- For lower-salinity brackish water, ED offers a (limited) cost alternative to RO that’s more than a theoretical possibility.
- The NSF/ANSI 58 standard that many people think of actually has no bearing on industrial BWRO systems.
Quick Specs
| Brackish TDS range | 1,000 – 10,000 mg/L |
| Typical feed pressure | 200 – 600 psi |
| Salt rejection | 96% – 99.5% |
| Recovery rate | 50% – 85% (75–90% in high-recovery designs) |
| Core process stages | 3 (pretreatment / RO / post-treatment) |
| Typical capacity range | 1 – 500 TPD (industrial) |
What Is Brackish Water, and Why Does RO Dominate Its Treatment?
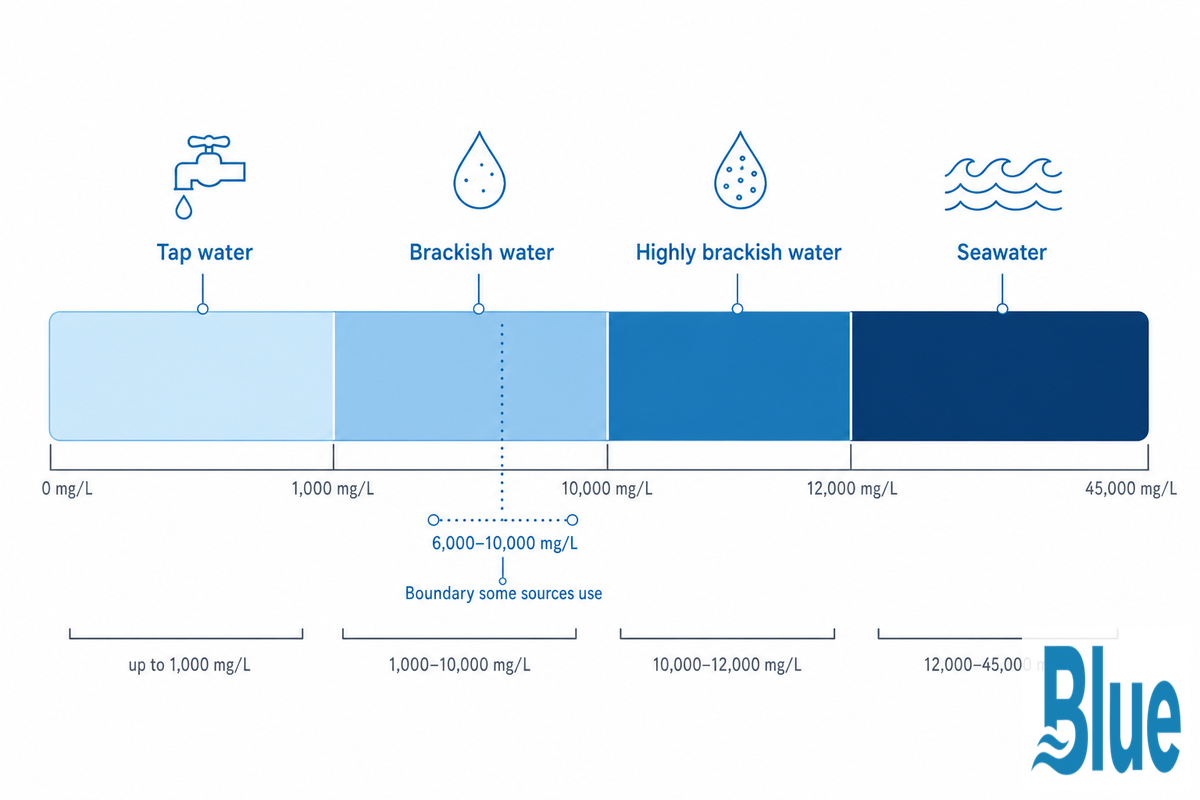
On the salinity scale, brackish water lies between freshwater (under 1,000 mg/L TDS) and seawater (32,000-45,000+ mg/L) — generally 1,000 to 10,000 mg/L TDS, according to the U.S. Geological Survey and the Texas Water Development Board (two widely-cited government sources on the subject).
| Water source | Typical TDS |
|---|---|
| Tap / fresh water | Under 1,000 mg/L |
| Brackish water | 1,000 – 10,000 mg/L |
| Highly brackish water | 10,000 – 12,000 mg/L |
| Seawater | 32,000 – 45,000+ mg/L |
Note: There’s not perfect consensus on where to draw the line: some references cite the upper bound of brackish water at 6,000 mg/L, and older interfacially-synthesized membrane research (from the 1980s) defined brackish water as 3,000-10,000 ppm. In practice, it’s more about how it’s handled than a strict chemical definition.
💡 Pro Tip
For purposes of this guide, we’re sticking with the more commonly referenced USGS/TWDB range of 1,000-10,000 mg/L.
Reverse osmosis is by far the dominant reverse osmosis water technology for treating brackish water, primarily because a reverse osmosis membrane can remove dissolved salts and other contaminants directly, at pressure levels that don’t prove overly burdensome for this range. Thin-film composite (TFC) RO elements are commonly rated at 99% or higher salt rejection, far exceeding the 70-90% or so that nanofiltration elements achieve on the same feed — so long as complete desalination, not partial softening, is the objective.
The 3-Stage BWRO Treatment Stack
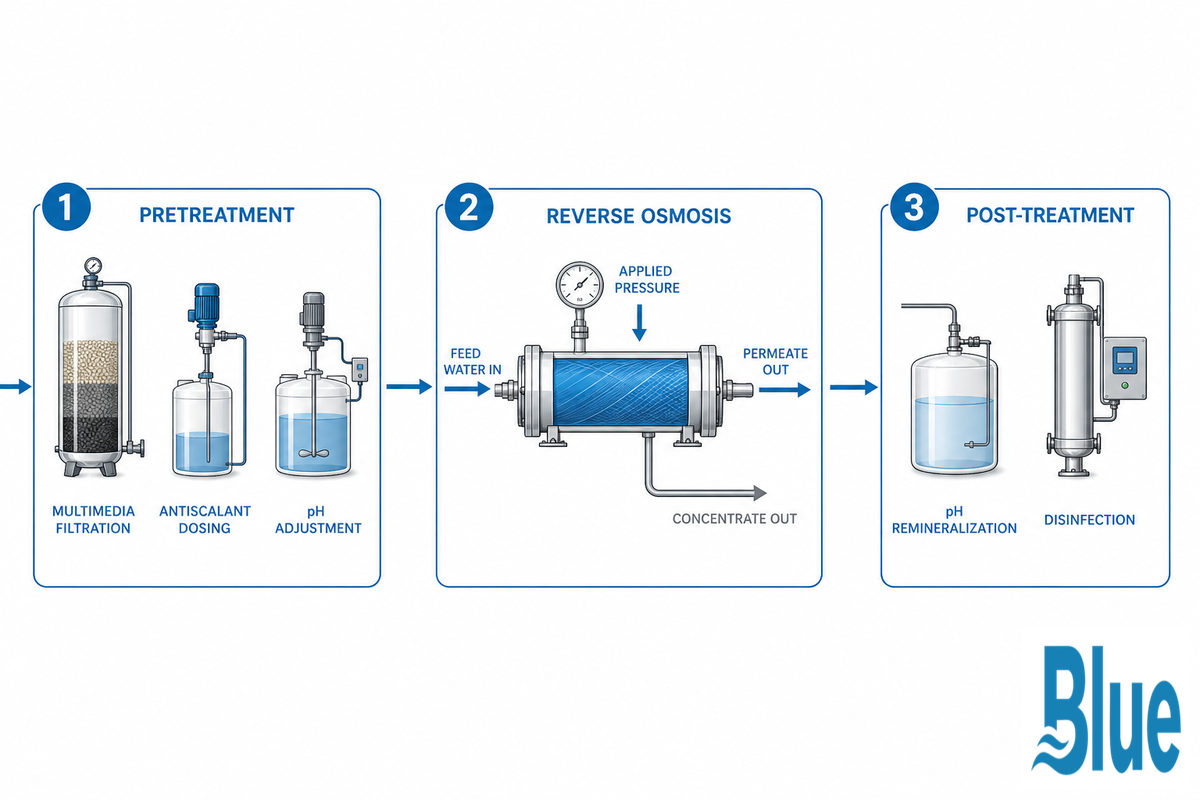
All brackish water reverse osmosis systems-whether they’re a municipal water supply project or an industrial water treatment installation, built by the lowest-cost bidder or the highest-end provider- follow the same three-step approach to treatment. The difference between a dependable, long-lasting system and one that’s prone to premature failure isn’t necessarily the number of stages, but rather how carefully each stage is tailored to the specific feedwater it will process.
The 3-Stage BWRO Treatment Stack
- Pretreatment — multimedia or cartridge filtration to remove suspended solids from the feed water, plus antiscalant dosing and pH adjustment to prevent scale formation under pressure, following the same pretreatment-method-selection logic documented in New Mexico Water Resources Research Institute’s assessment framework. This step exists purely to keep the membrane at optimal performance and prevent scaling from prematurely destroying it before it even reaches the RO stage.
- RO filtration — the pre-treated feed water is forced at 200-600 psi through a semipermeable polyamide membrane, rejecting dissolved salts and impurities to a concentrate stream and letting purified RO water through to the output as permeate. Salt rejection rates are tracked continuously to confirm the membrane is performing as designed.
- Post-treatment and stabilization — this step adjusts pH and re-introduces minerals as required (for example, drinking water for specific end uses) to ensure the water is ready for distribution or other applications.
This most common design shortcut – jumping directly to “which membrane?” without designing the first stage – is an expensive mistake. A groundwater supply that has high iron, manganese or hardness levels will foul a membrane sized for a municipally-produced feed stream in months, rather than years, irrespective of how good the membrane may be.
“The pretreatment stage is where most BWRO project budgets get underestimated. Buyers price the membrane skid and forget that a groundwater source with iron or hardness needs a dedicated pretreatment train, not an afterthought.”
RO vs. Nanofiltration vs. Other Technologies — Is RO Actually Right for You?
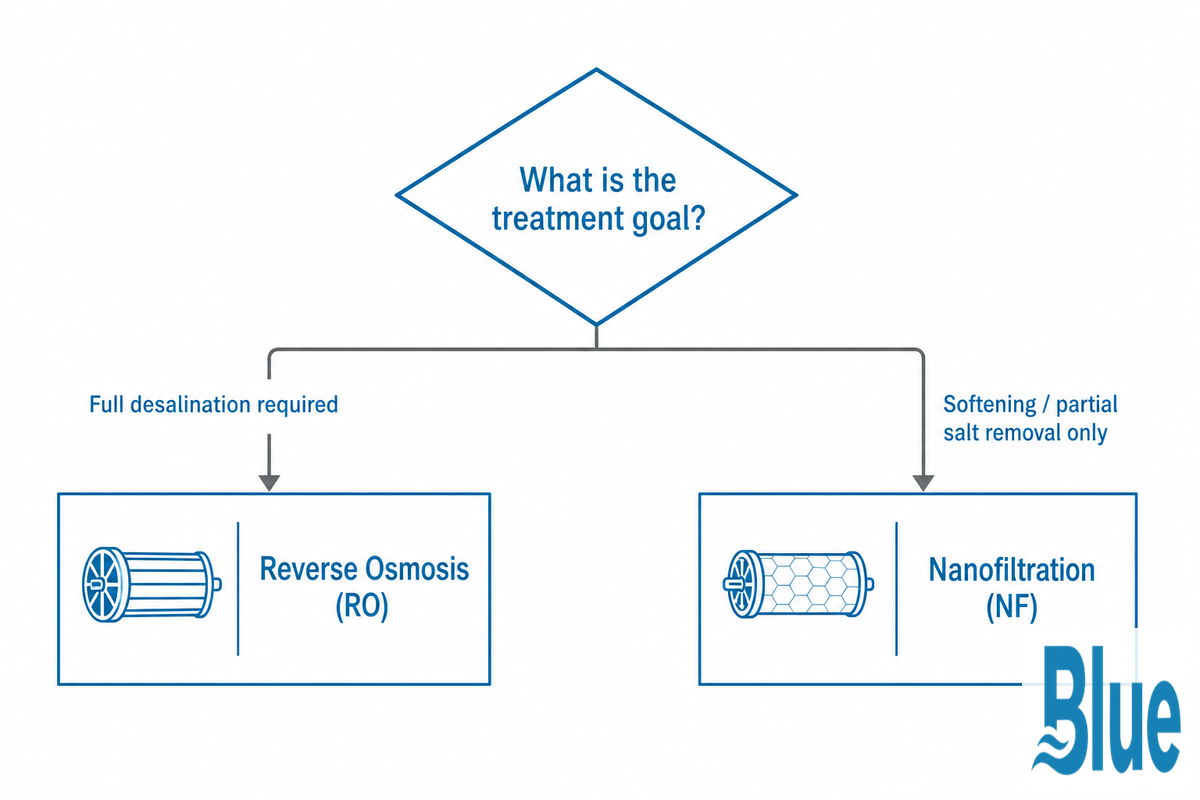
The correct choice of reverse osmosis technology, not necessarily RO in every case, depends on the required finished water product: total desalination, or simply a reduction in overall salinity or hardness. Buyers who default straight to RO without checking that requirement first sometimes pay for more desalination than the application actually needs, when a lower-pressure alternative would have done the job at lower energy cost.
| Category | Feed salinity class | Recommended technology | Why |
|---|---|---|---|
| Municipal drinking water | 1,000–3,000 mg/L | RO, or ED as a cost comparison | ED marginally cheaper at this low end per 2024 peer-reviewed data — worth a comparative quote |
| Municipal drinking water | 3,000–10,000 mg/L | Reverse osmosis | >99% salt rejection needed; ED’s cost edge disappears above ~3 g/L |
| Industrial boiler feed makeup | 1,000–10,000 mg/L | Reverse osmosis | Low residual ion tolerance for boiler internals demands full desalination |
| Cooling tower makeup | Under 5,000 mg/L | Nanofiltration (if only hardness matters) | Lower pressure and energy draw when full salt removal isn’t the actual requirement |
| Well water, iron/manganese present | Under 5,000 mg/L | RO, well-water-specific pretreatment config | Standard pretreatment won’t stop Fe/Mn fouling — needs a dedicated train |
| Food and beverage process water | 1,000–8,000 mg/L | Reverse osmosis | Product-quality water specs typically require near-total dissolved-salt removal |
| Agricultural / irrigation supply | 1,000–6,000 mg/L | RO, high-recovery configuration | Recovery matters more than absolute lowest cost when concentrate disposal is land-constrained |
| Water reuse / reclamation loops | Varies by source stream | Reverse osmosis | Reclaimed-water quality targets generally track potable-adjacent standards |
| Softening only, no desalination goal | Any brackish range | Nanofiltration | 70–90% rejection is sufficient when the target is hardness/selective ions, not full TDS removal |
| Highly brackish / near-seawater feed | 10,000–12,000+ mg/L | Seawater-rated RO | Standard brackish elements aren’t rated for this pressure/chemistry class — see our seawater RO systems guide |
Take that third row for a moment: a study cited more than 100 times in Water Research compared ED and RO across a range of brackish salinities and found ED was “more economical than RO for feed salinities < 3 g/L, albeit to a minor extent” — though the same research notes ED’s limited wider uptake stems from RO’s decades-long head start in manufacturing volume. In plain terms: for lower-salinity brackish water, ED is a valid alternative worth investigating, not a decisive winner.
💡 Pro Tip
If the TDS of your feed stream exceeds 3,000 mg/L, RO’s market penetration and component availability mean it is more cost-effective, with ED only being considered at lower salinity values.
The Engineering Behind It — Osmotic Pressure, Recovery Rate, and Why There’s a Ceiling
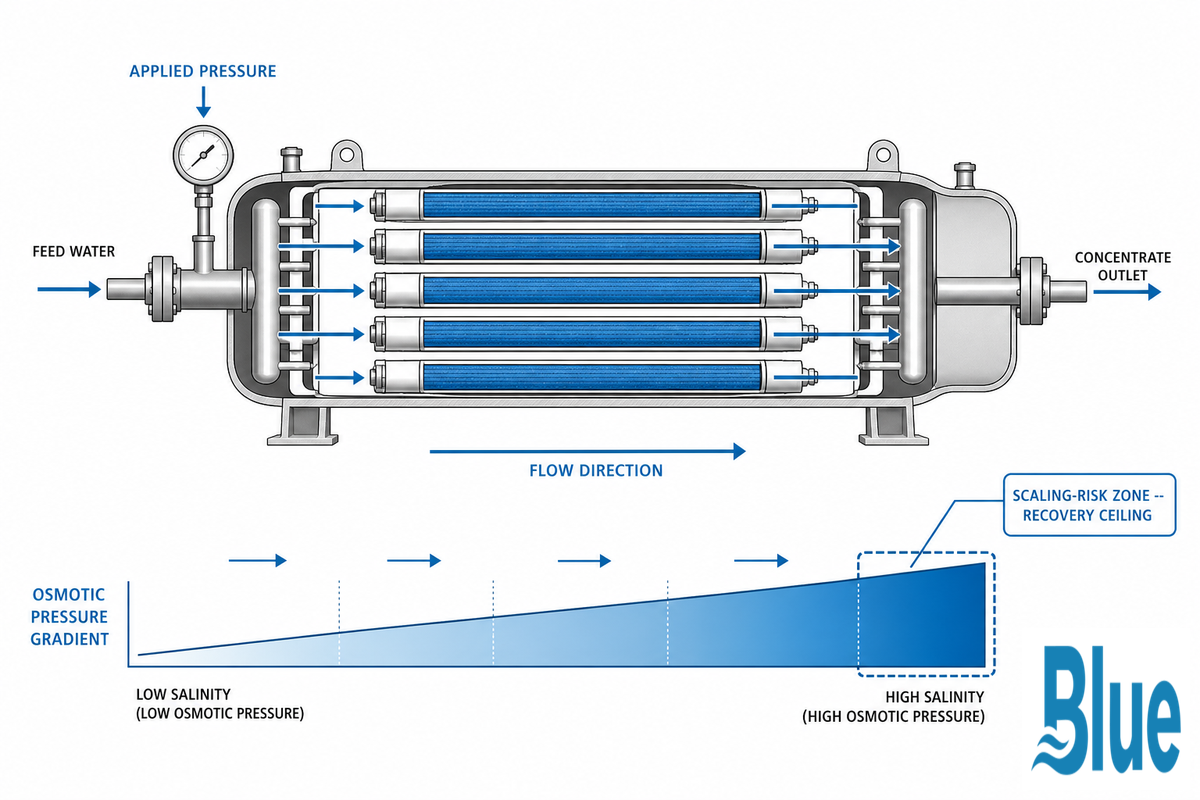
Reverse osmosis operates on the principle of applied pressure exceeding the feed water’s natural osmotic pressure – the point where water would normally flow to the higher-concentration side of the membrane. Applying pressure above this point forces purified product water across the membrane to the permeate side, while retaining salts on the reject side.
- Osmotic pressure rises about 0.7-1.0 psi per 100 mg/L of TDS of the feed, so the applied pressure must exceed this amount in order for water to flow across the membrane and form the pure water.
- High TDS feed will bring the required applied pressure up to the higher end of the 200-600 psi range.
Recovery rate – the fraction of the feedwater that’s converted to usable, high-quality water for downstream use – is hard-capped, and not for a whimsical reason. As recovery increases, the concentrate solution carries a progressively larger fraction of the original salt in a shrinking volume of water until the tendency of scaling at the trailing elements of the array become limiting. That’s the textbook explanation, and as far as it goes, it’s true.
📐 Engineering Note — Worked Example
To get a ball park estimate – though exact osmotic pressures will vary with temperature and dissolved ions in addition to TDS – a well feeding into a system at 4,000 mg/L TDS will exert roughly 28-40 psi of osmotic pressure. That system, operating at 250 psi, is therefore running at multiple times this pressure — the surplus is what drives flux and overcomes membrane resistance.
Run that well at 9,000 mg/L, and that osmotic baseline rises toward 63-90 psi (a partial reason high-TDS brackish sources may need 400-600 psi treatment compared to 200 psi) — a relationship the Texas Water Development Board’s own energy-optimization study of brackish groundwater RO plants documents in detail. Consider those psi figures as order-of-magnitude estimates rather than a replacement for an actual feedwater-specific engineering calculation.
But this is where the research is a bit more interesting than the simple explanation. One 2024 analysis of energy efficiencies of different brackish desalination technology platforms showed that increasing recovery isn’t necessarily the most energy efficient move, regardless of whether or not scaling is an issue, because increases in the osmotic pressure of the concentrate water require higher system pressures and thereby more pump energy. Designing for high-recovery targets without first checking for the impacts on scaling and energy demands given the actual feedwater chemistry is a very real, common design flaw that drives unplanned downtime and higher running costs, not an imaginary one.
💡 Key Takeaway
Another reason that brackish systems have an edge over seawater in energy-efficiency terms: they don’t have to overcome seawater’s high osmotic pressures. Brackish systems typically operate at 200-600 psi against seawater’s 800-1,200 psi-partially why the energy demand for brackish desalination (0.5-3 kWh/m3) is much lower than for seawater desalination.
System Types at a Glance
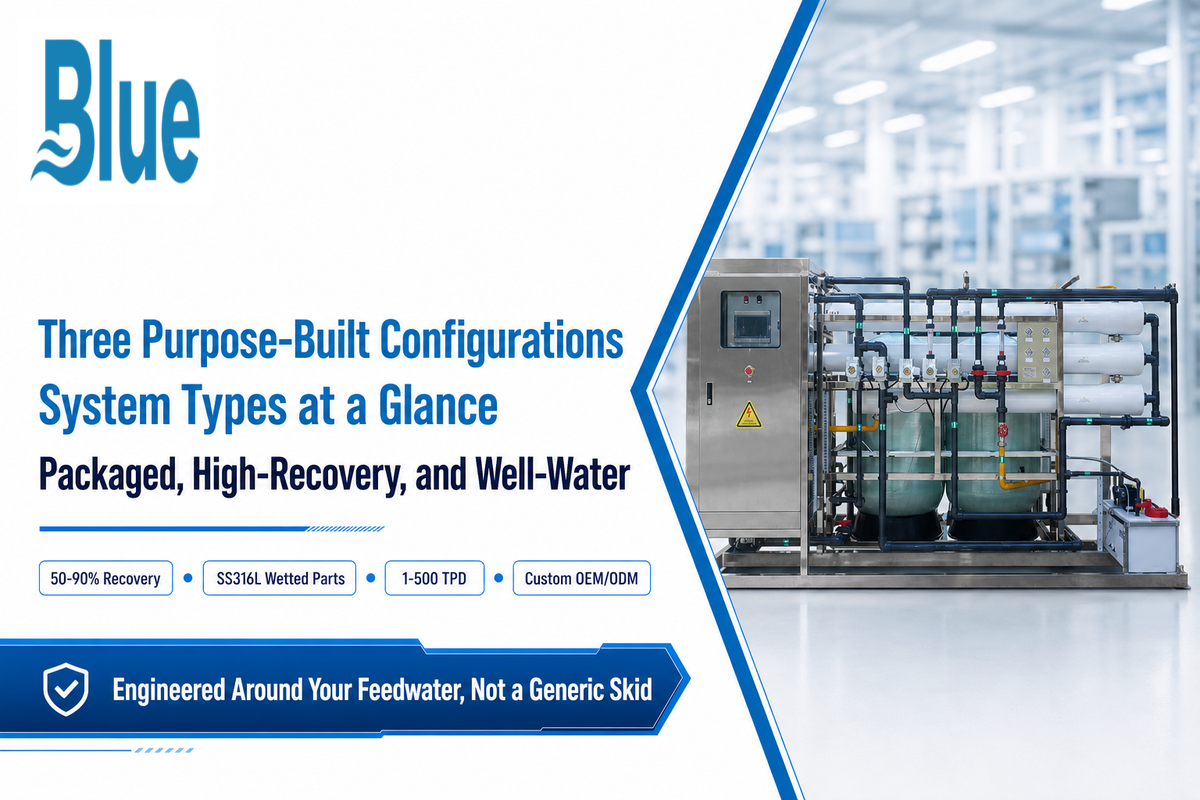
Brackish water RO systems generally come in three categories: those with high-recovery designs targeting low-volume concentrate (where disposal is costly, per New Mexico’s own strategic water supply feasibility study), those that are packaged and containerized for rapid deployment, and well-water specific configurations featuring integrated iron, manganese, and hardness pretreatment.
- Disposal cost is your key constraint → start with a high recovery system
- Deployment speed is critical → start with a packaged and containerized system
- Your feed has iron, manganese or hardness → start with a well water specific configuration
Which category is right for you depends less on a spec sheet number and more on your particular feed water chemistry and disposal constraints. While a direct comparison of each system configuration (and the specific recovery rates, pressure requirements and TDS limits of each) can be found on Blue Membrane’s brackish water RO systems page, the general principle is: match the system to the constraint first, and then examine the specs within that category.
Where Brackish Water RO Is Actually Used
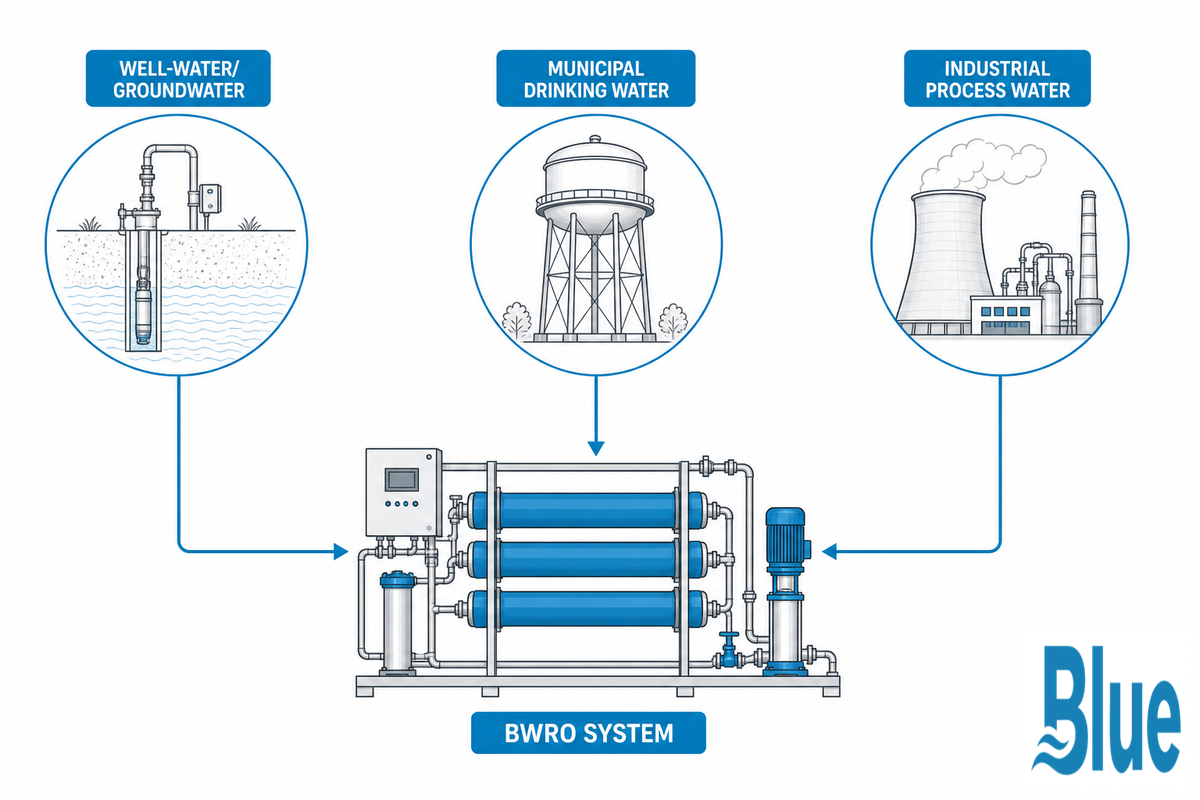
Brackish water RO has applications much more widespread than its “desalination plant” image suggests — a U.S. Department of Energy technoeconomic analysis maps this range across municipal and industrial uses in detail. From inland drinking water utilities to boiler feed makeup and irrigation supply, the common thread is a feedwater source too saline for direct use but not saline enough to require seawater-grade equipment.
- Municipal water – inland communities and utilities treating brackish groundwater where surface freshwater is scarce or already allocated, to produce safe drinking water for the public supply.
- Industrial process water – boiler feed makeup, cooling tower makeup, and food and beverage production, using brackish water RO membrane elements to protect equipment from scaling and corrosion.
- Water reuse loops – treating brackish wastewater streams with reliable water purification systems for reclaimed non-potable reuse, reducing a facility’s freshwater draw.
- Rural and well-fed systems – village-scale and rural groundwater purification, usually paired with iron/manganese pretreatment; and agricultural and irrigation supply, where source water salinity would otherwise limit crop options.
A useful gut-check: municipal and industrial water buyers weigh priorities differently. Municipal and utility buyers tend to prioritize regulatory compliance and consistency above raw throughput, while industrial buyers usually size the system to a specific downstream process spec rather than a generic water-quality target. Knowing which camp you’re in shapes which questions to ask a supplier first.
What Actually Drives the Cost of a BWRO System
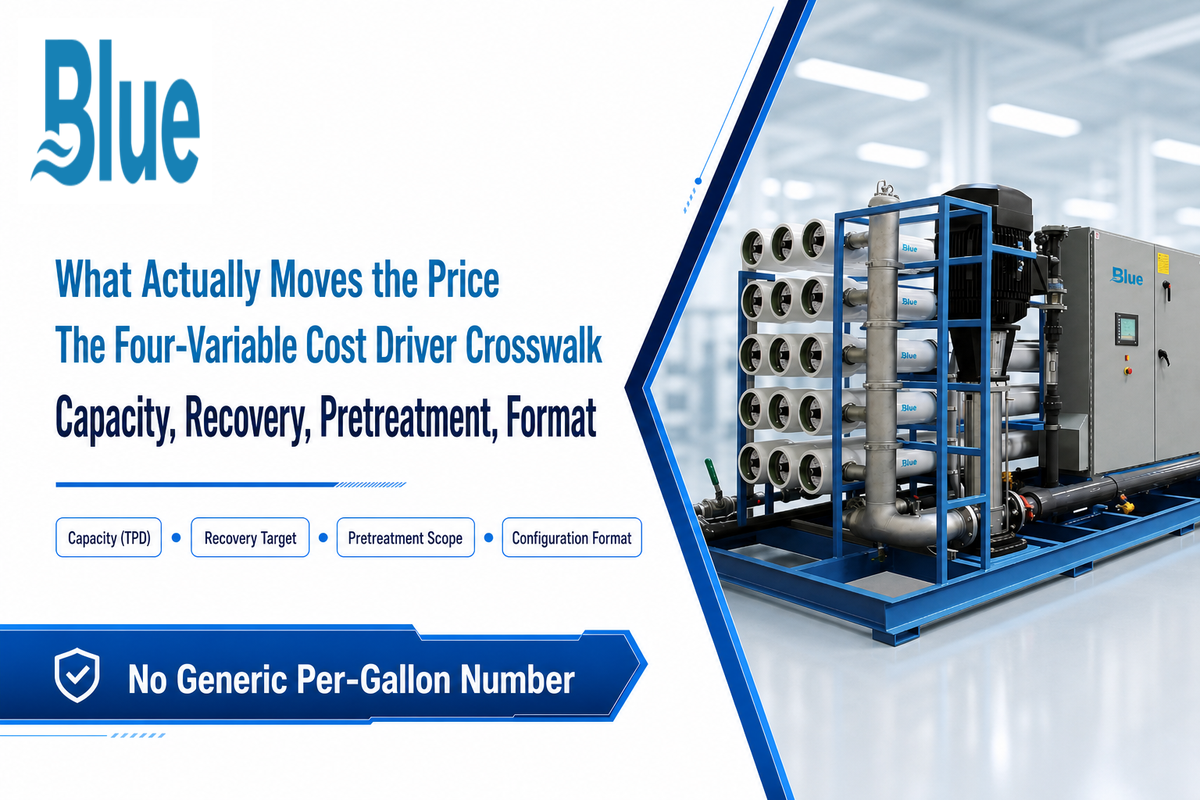
There’s no honest single “$X per gallon” number for brackish water desalination – costs vary too much by site. What’s useful instead is knowing which variables actually move the price and which choices reduce operational costs over the system’s life, so a rough estimate is possible before a formal quote.
Four-Variable Cost Driver Crosswalk
- Production capacity (TPD) – the single biggest lever; larger systems have better per-gallon economics but higher absolute capital cost.
- Recovery target – high-recovery hydraulics (multi-stage boosters, VFD control) cost more upfront but reduce concentrate disposal volume over the system’s life.
- Pretreatment scope — a standard feed needs far less pretreatment investment than a well source with iron, manganese, or high hardness.
- Configuration format – skid-mounted, split, or fully containerized builds carry different fabrication and shipping cost structures.
On the operating side, one of the few publicly available peer-reviewed cost benchmarks comes from a 2021 study of Southwest Florida utilities: OPEX for brackish water ro drinking-water production there ranged from $0.36 to $0.66 per cubic meter. That’s a genuinely useful reference point – but it’s a Southwest Florida municipal drinking-water benchmark specifically, not a universal number. Industrial BWRO costs vary substantially by disposal method, pretreatment scope, and regional energy prices, so treat it as one calibration point for your own water treatment equipment budget, not a quote.
⚠️ Important
Recovery rate and disposal cost are the same decision, not two separate ones – an incrementally higher recovery target that shrinks your concentrate volume can be worth a higher-cost hydraulic package if your disposal path is deep-well injection or a permitted evaporation pond. If you already have a low-cost sewer discharge option, the calculus flips.
Permitting and Regulatory Basics Buyers Skip Until It’s Too Late
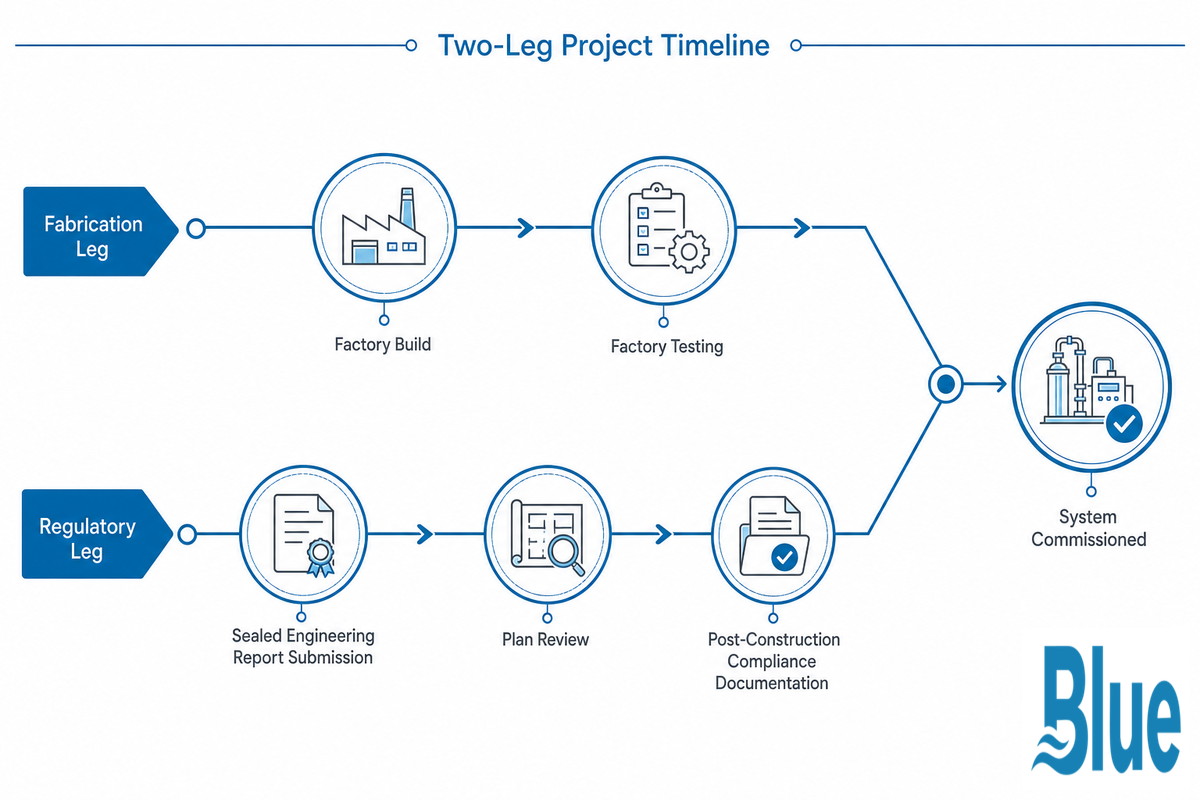
Most buyers researching brackish water desalination focus on the system itself and treat “permitting” as a single line item. In practice, there are two independent regulatory tracks, and missing the second one is the more expensive mistake.
Two Independent Regulatory Tracks
- System construction approval. States regulating groundwater for public water systems, like Texas and its TCEQ, generally require a two-stage approval process: sealed engineering reports and drawings approved prior to installation, followed by documentation that the as-built system actually produces potable water. Containerized or skid-built systems don’t shorten the review period, even though they speed up fabrication and installation time.
- Concentrate disposal permitting — the part of the process buyers most often ignore entirely. All RO and NF systems produce a reject-water stream, typically 15 to 30% of the feed flow, that must be disposed of, triggering its own permit process.
Deep-well injection often falls under Underground Injection Control (UIC) programs — Florida’s environmental agency, for example, permits large reject-water injection wells as Class V, requiring a permit and monthly operating reports. Surface discharge instead falls under the National Pollutant Discharge Elimination System (NPDES), a federal Clean Water Act program that 47 states and one territory manage as a delegation from the U.S. EPA rather than centrally — meaning the exact process genuinely differs by state.
| Regulatory track | Governs | Typical mechanism |
|---|---|---|
| System construction | The RO system itself meeting drinking-water standards | Engineering report pre-review + post-construction verification (e.g., Texas TCEQ) |
| Concentrate disposal — deep well | Injecting reject water underground | Underground Injection Control (UIC), Class V permit + monitoring |
| Concentrate disposal — surface | Discharging reject water to surface waters | NPDES permit, implemented by 47 states + 1 territory individually |
One more point on standards: when a buyer mentions wanting a system certified to NSF/ANSI 58, the relevant distinction to keep in mind is that this standard is for point-of-use appliances, not industrial or municipal installations. It’s worth asking a supplier selling industrial-class equipment to be specific about what its certifications actually cover.
Industry Outlook — What’s Changing in Brackish Water RO
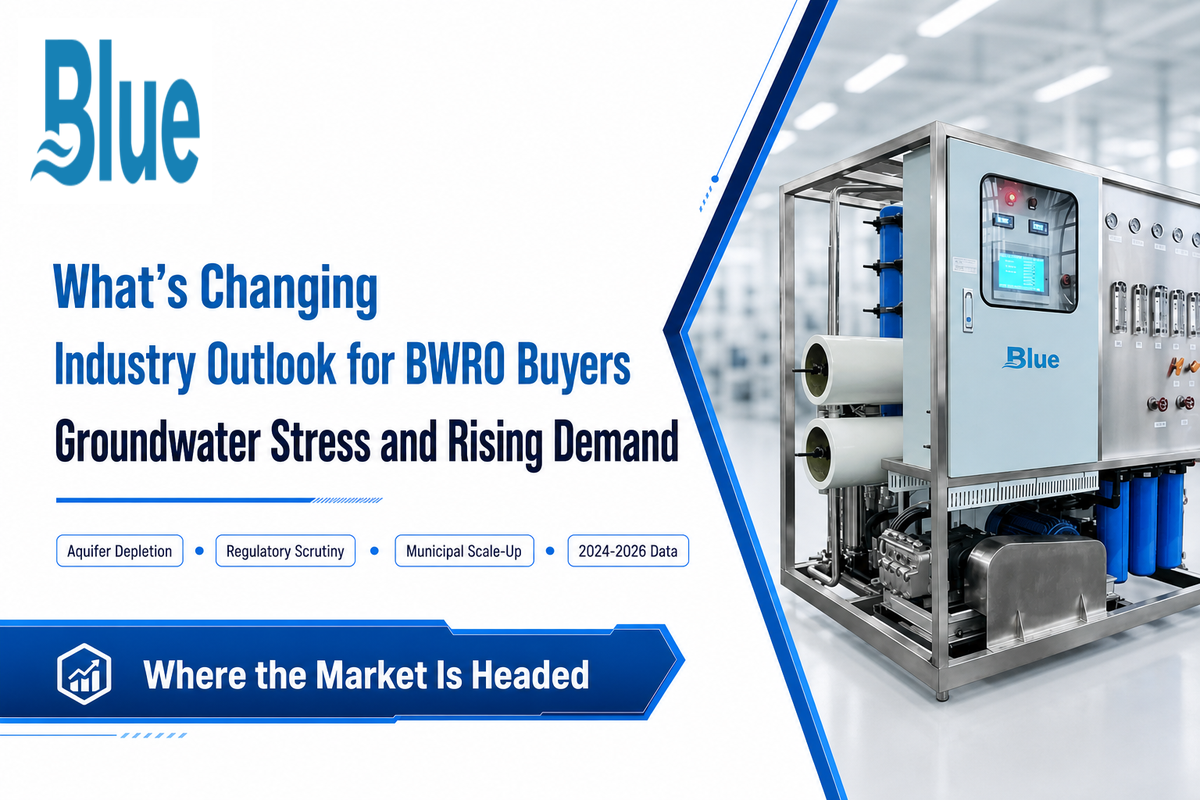
What’s driving interest in brackish water desalination more than any new membrane technology is what’s happening to the freshwater resource itself, as many regions face growing water scarcity and their traditional brackish water sources shift toward higher salinity. According to the U.S. Geological Survey, historical records show declines in water table depth by nearly 400 ft around Houston, more than 200 ft near Baton Rouge, 300 to 500 ft in parts of Arizona, and as much as 900 ft in the Chicago-Milwaukee area since 1864, thanks to decades of over-pumping.
- A 2025 peer-reviewed modeling study projected that 60-70% of sustainability indicator wells in California’s Central Valley could miss their 2040 targets under continued demand growth — a specific, worked example of the broader national pattern, not a nationwide figure itself.
- The shallower freshwater aquifers are drying up, and where water is available it tends to be saltier, not fresher.
This trend offers a concrete planning cue for anyone looking at water today. Municipal and industrial users that may have only previously required softening or simple filtration are now being compelled to seriously investigate BWRO options earlier than their initial site plans had suggested.
💡 Pro Tip
Although brackish desalination market size estimates from several research firms generally trend upward, that figure isn’t enough in itself to drive action. You should evaluate your current water solutions strategy because your actual feedwater is moving toward a higher salinity, more saline water profile, whether you have an existing system or not.
Q: What is the difference between tap water RO and brackish water RO membranes?
View Answer
Both systems use the same chemistry-a thin-film composite polyamide-but brackish elements are designed for high pressure-200-600 psi typically versus 30-150 psi for tap water-and incorporate a feed spacer geometry engineered for a heavier fouling load. Forcing tap-water elements under genuine brackish conditions will result in scaling and fouling that shortens membrane life and causes rapid, premature failure; attempting to use brackish elements on tap water will function but it’s a waste of the extra capacity you paid for. Neither swap is a substitute for matching membrane solutions to your actual feedwater chemistry.
Frequently Asked Questions
What is the best way to treat brackish water?
View Answer
Among the benefits of brackish water RO: for full desalination, it’s the default choice, offering treated water with salt removal generally greater than 99% for thin-film composite elements, serving both industrial and municipal water treatment industry needs. You should look to the system’s objective to answer this: If the only goals are softening or removing just a subset of salts rather than providing complete treatment, then NF can often do the job more affordably at lower pressures. Start any technology discussion with your raw water quality report-TDS, hardness, any iron, arsenic, or other constituents of concern-not an assumption.
Can brackish water be filtered to drink safely?
View Answer
Yes, with proper treatment — it is not safe to drink untreated. Brackish water needs filtration and desalination through a reverse osmosis system, in most cases, to remove excess dissolved solids before it meets drinking-water standards. Water purification to potable quality from a brackish source follows the standard three-stage treatment described above.
What’s the difference between brackish water RO and seawater RO (BWRO vs. SWRO)?
View Answer
While the basic mechanism is the same (pressure-driven rejection across a semipermeable membrane), the pressure ranges differ substantially. Brackish elements operate at roughly 200–600 psi against feed of 1,000–10,000 mg/L TDS, whereas seawater systems may need as much as 800–1,200 psi to counteract the far higher osmotic pressure of 32,000–45,000+ mg/L feed, and use membranes engineered for that higher pressure class. That’s also the principal reason why brackish RO’s energy intensity (roughly 0.5–3 kWh/m³) sits well below seawater desalination’s. For a full breakdown of seawater-specific system design, see our seawater RO systems guide.
What are containerized or packaged BWRO systems?
View Answer
These pre-piped and pre-wired, packaged solutions are delivered on skids, as split units, or inside shipping containers and can meaningfully speed up site assembly. They do not speed up the process of securing permits (see the permitting section above). See Blue Membrane’s packaged BWRO systems for configuration specifics.
Is a brackish water RO system the same as a residential water softener?
View Answer
No. Household softeners swap sodium or potassium ions for hardness ions (calcium, magnesium) but leave overall TDS and most other dissolved salts untouched. A brackish RO system rejects the great majority of dissolved solids, at industrial-scale flow rates, with dedicated process controls and pretreatment a household softener doesn’t have.
How long does a BWRO project take from decision to operation?
View Answer
There’s no single consistent answer, because the timeline splits into two legs that run on different clocks. Equipment fabrication and testing is the leg a manufacturer controls directly, often compressed by fast, modular systems. Regulatory review is the other leg — covering both system construction approval and, separately, concentrate disposal permitting if deep-well injection or surface discharge is involved. Ask any supplier to quote both legs separately rather than a single headline figure that quietly assumes the disposal permit is already in hand.
Advantages / Limitations of Brackish Water RO
✔ Advantages
- Salt rejection commonly above 99% for full desalination needs
- 200-600 psig operating range-much lower energy demand than seawater RO
- Modular, scalable from 1–500 TPD
- Decades of mature, widely available parts and service ecosystem
⚠ Limitations
- Concentrated waste stream (usually 15-30% of the input flow) must have a separately approved disposal plan and infrastructure
- Recovery rate has an intrinsic, real-world limitation. Driving this rate too high increases scaling risks and energy demand.
- Feeds with iron, manganese, and very high hardness require their own pretreatment steps, and this comes at an added expense
- In fact, very low levels of brackish salinity will actually reduce the economic advantages RO holds over electrodialysis.
Why We Write This
Blue Membrane manufactures reverse osmosis and separation membrane products serving industrial, municipal, and specialty markets globally, including the brackish water RO systems referenced throughout this guide. This guide exists to help engineers separate the well-documented physics and regulations of BWRO systems from the unsupported marketing claims that fill most content online, so you can walk into a system quote already knowing what to ask. Reviewed by the Blue Membrane technical team.
References & Sources
- Groundwater Decline and Depletion — U.S. Geological Survey
- Seawater and Brackish Water FAQ — Texas Water Development Board
- NSF/ANSI 58: Reverse Osmosis Drinking Water Treatment Systems — NSF International
- About NPDES — U.S. Environmental Protection Agency
- Economics and Energy Consumption of Brackish Water Reverse Osmosis Desalination — Pearson et al., peer-reviewed (PMC)
- The Potential of Electrodialysis as a Cost-Effective Alternative — Patel et al. 2024, National Science Foundation Public Access Repository
- Modeling Future Groundwater Depletion — American Geophysical Union, Water Resources Research (2025)
- Energy Optimization of Brackish Groundwater Reverse Osmosis Desalination — Texas Water Development Board
- Assessment and Implementation Framework for Brackish Groundwater Desalination — New Mexico Water Resources Research Institute
- New Mexico Strategic Water Supply Feasibility Study — New Mexico Environment Department
- Analysis of Brackish Water Desalination for Municipal Uses — U.S. Department of Energy (OSTI)
Related Articles
- Brackish Water RO Solutions — compare Blue Membrane’s three purpose-built system configurations
- Brackish Water RO Membrane Elements: Complete Guide — element-level construction, sizing, and replacement signals
- Seawater RO Systems: How SWRO Works, Costs, and Specs
- Nanofiltration Membrane (NF) Guide for Water Treatment
- Well Water Brackish RO Treatment — configuration built for iron/manganese/hardness feedwater
- High-Recovery BWRO Design — for sites where concentrate volume is the binding constraint