Get in touch with Blue Membrane Company


A nanofiltration membrane is best understood as a selective separation layer, not a weaker version of reverse osmosis. Within plant design, nanofiltration usually sits between ultrafiltration and full desalting designs: it can reduce hardness, color, sulfate, larger organics, and some minerals while allowing more sodium and chloride to pass than the tighter process.
Quick Specs Snapshot
- Process type: pressure-driven separation, placed between ultrafiltration and full desalting designs in most plant layouts.
- Typical selection goal: selective hardness and organic reduction rather than total TDS removal.
- Spec check: never compare MgSO4 or NaCl removal without pressure, feed concentration, temperature, pH, and recovery.
- Blue Membrane example: the product page publishes N1/N2/N3 grade information and element-format data for buyers who need current specifications.
- Selection risk: pretreatment, scaling, membrane fouling, and concentrate disposal can outweigh a catalog rating.
This guide is meant to help buyers read membrane specifications, compare nanofiltration against tighter and looser membrane options, and decide when selective removal is the better engineering choice. If you already know your target feed and want element-level product data, review N1/N2/N3 NF membrane specifications on the Blue Membrane solution page.
Definition: Nanofiltration Membrane
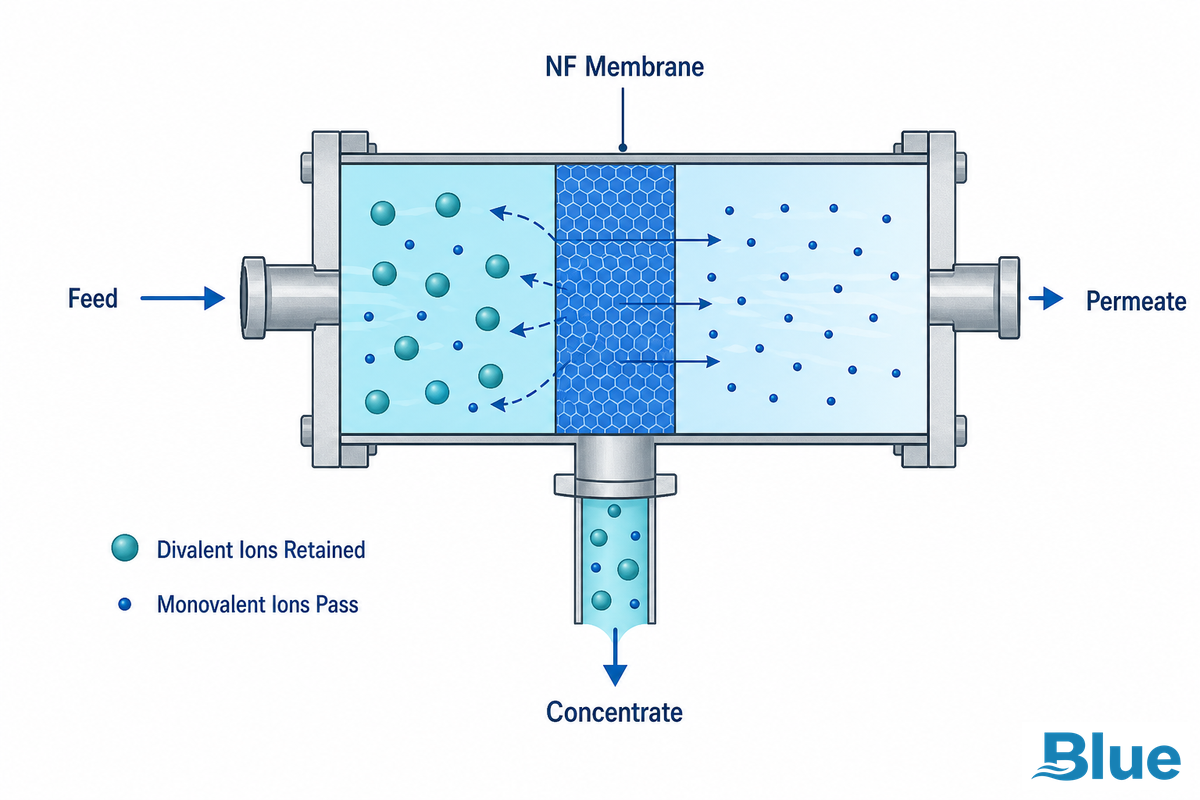
A nanofiltration membrane is a semi-permeable membrane used under pressure. Water and some small dissolved species pass through the membrane as permeate, while selected minerals and molecules remain in the concentrate stream. The U.S. EPA groups it with other pressure-driven membrane processes that push water through a semi-permeable barrier, while noting that the process can address hardness, odor, color, synthetic organic chemicals, and disinfection byproduct precursors.
Selectivity is the practical point. Nanofiltration does not chase maximum removal for every dissolved solid. Its value often come from retaining sulfate and calcium more strongly than sodium and chloride. That’s why the process appears in softening, sulfate control, color removal, process-water reuse, food and beverage concentration, and certain reuse polishing duties.
Nanofiltration is a membrane technology built around controlled passage through a membrane surface. Buyers will often see it discussed by pore size, molecular weight cutoff, or both; first-party product literature may describe ranges around 1 nm and 200-1,000 Da, while application notes may mention broader 0.1-10 nm porous separation language. Treat those figures as orientation, then ask how the membrane performed on the target feed.
Procurement teams should treat nanofiltration as a separation process that often uses thin-film composite membranes for spiral-wound elements. Membrane sheet chemistry sets much of the selectivity; the element format set how that sheet is packed into a pressure vessel.
Selection risk appears when an industrial buyer treats nanofiltration as a fixed pore-size product; the problem is that feed composition and recovery can change selectivity. Compare the membrane under reference conditions such as 100 psi and 25 C, then request factory QA, certification traceability, and precision coating notes from the supplier. That evidence shows whether the product is engineered to hold selectivity outside a clean-water example.
The NF Selectivity Ladder: 9-Point Screening Method
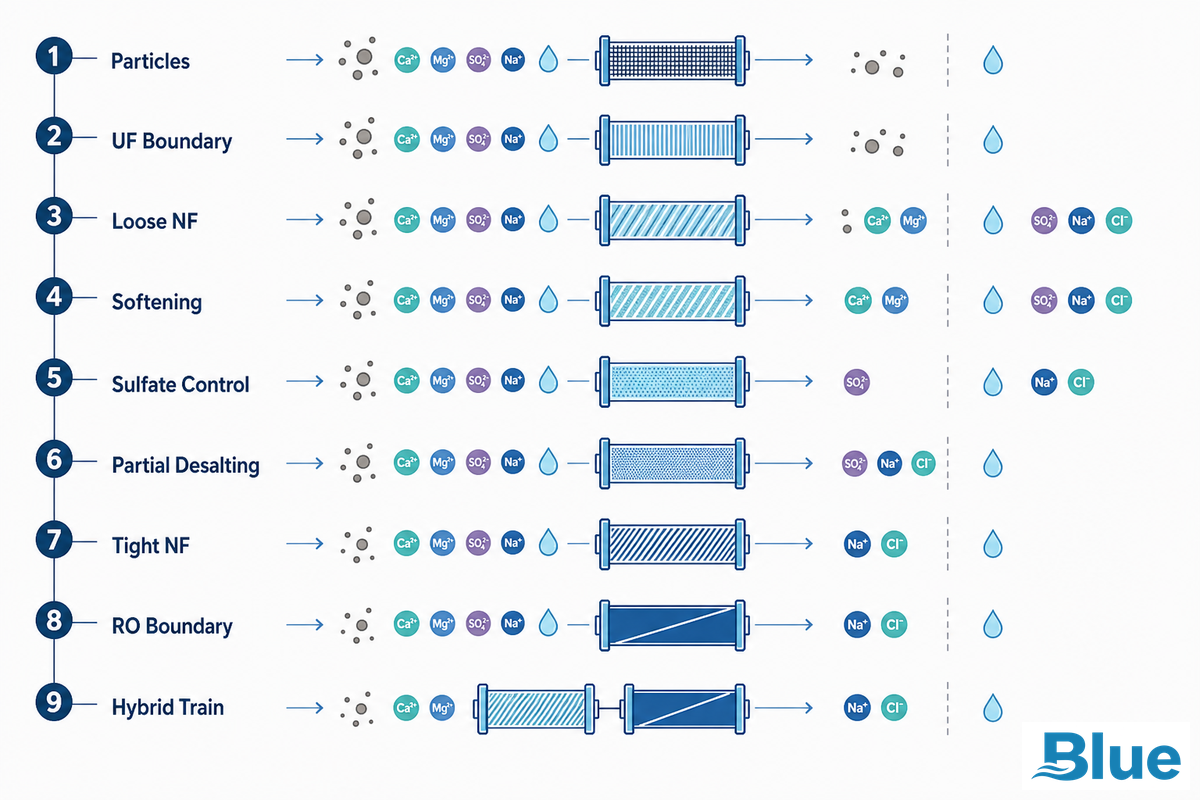
Use this ladder before comparing datasheets. It keeps the selection discussion centered on separation need, not only on a single performance value.
| Type / tier | Main separation target | Spec to verify | Buying action |
|---|---|---|---|
| 1 – Particulate barrier | Suspended solids | Pretreatment rating | Use before the membrane stage, not instead of it. |
| 2 – UF boundary | Colloids and macromolecules | UF molecular cutoff | Choose when minerals should remain largely untouched. |
| 3 – Loose nanofiltration | Color, larger organics | Organic removal at actual pH | Ask for pilot data when color drives the decision. |
| 4 – Softening grade | Ca2+, Mg2+, hardness | MgSO4 removal at 2,000 ppm and 100 psi when used as the reference test | Compare only equal test conditions. |
| 5 – Sulfate grade | SO4 2- control | Sulfate removal and flow at target recovery | Check scaling risk before raising recovery. |
| 6 – Partial desalting | Selective mineral reduction | NaCl passage, MgSO4 removal, and permeate TDS | Use when retaining some minerals is useful. |
| 7 – Tight grade | Small organics and higher mineral cut | Flow loss versus selectivity gain | Compare energy and cleaning duty against the tighter option. |
| 8 – Full desalting boundary | Broad TDS reduction | Removal rating and pressure | Move to full desalting when total desalination is the target. |
| 9 – Hybrid train | Staged nanofiltration plus polishing or ion exchange | Whole-train recovery and concentrate load | Model the plant, not only the element. |
Application testing exposes the trade-off: a membrane can pass a 2,000 ppm MgSO4 check at 100 psi yet still fail the use case if scaling risk or color bodies dominate. Production water data should guide the ladder because each tier needs a different pretreatment and concentrate plan. Request factory QA, certification traceability, and precision element records when a supplier claims one grade can cover every tier.
Nanofiltration vs Reverse Osmosis vs Ultrafiltration: The Separation Decision Matrix
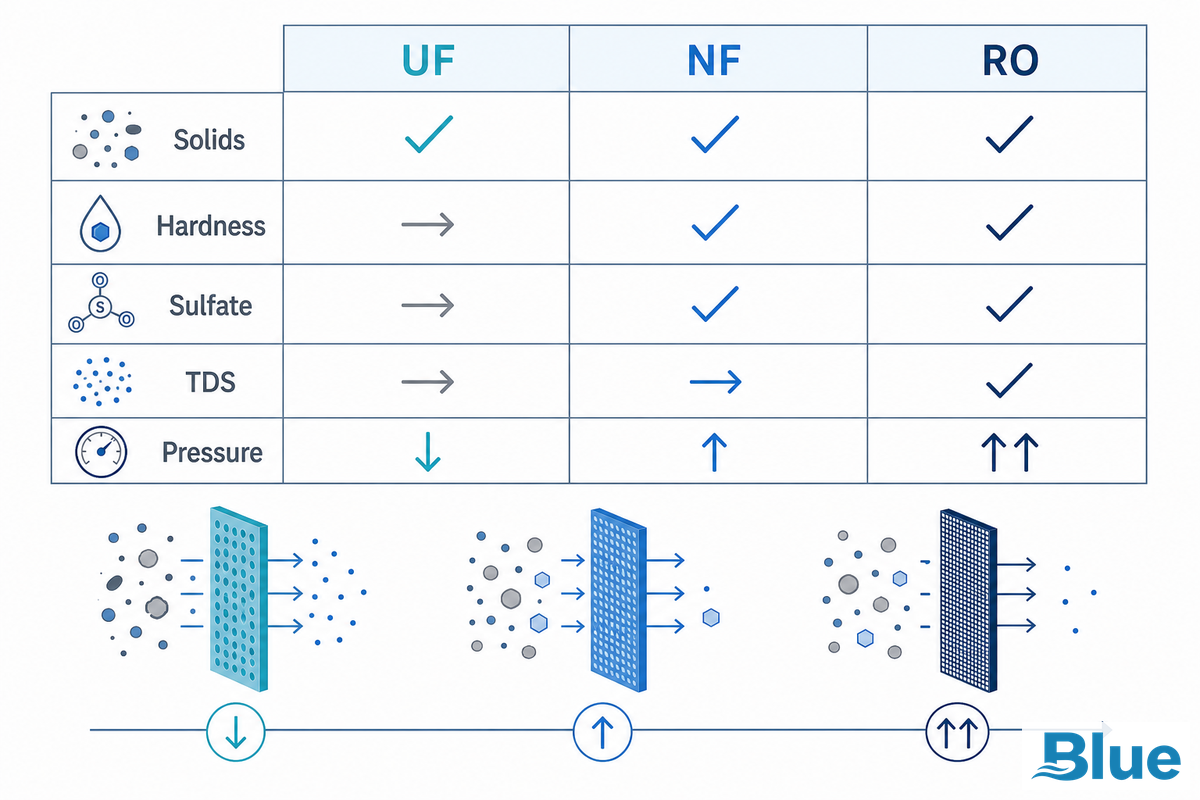
UF is mainly a physical barrier for suspended solids, colloids, bacteria, and larger macromolecules. Reverse osmosis is selected when the plant need broad mineral reduction, such as seawater desalting or ultrapure-water pretreatment. Nanofiltration sits between them. It’s chosen when the plant need more than UF but less than full desalting.
Nanofiltration advantages
- Selective hardness and sulfate removal.
- Often lower pressure than the tighter process for similar feed quality goals.
- Useful where some mineral passage is acceptable or desired.
- Can reduce organic color and disinfection byproduct precursors.
Nanofiltration limits
- Not a universal barrier for all minerals.
- Selectivity changes with feed chemistry and pH.
- Deposits can erase catalog flow.
- Concentrate still needs a legal disposal path.
A common mistake is to ask, “Which membrane removes more?” A better first question is, “Which species should pass?” CORDIS reporting on selective membrane work makes the same point from another angle: it isn’t always desired to retain everything. In procurement terms, lower NaCl retention can be an advantage when taste, mineral balance, or downstream process chemistry matters.
Wrong choices usually come from treating UF, nanofiltration, and full desalting as a simple price ladder. That trade-off is structural because nanofiltration may solve hardness at 100 psi while the tighter process may be needed for broad TDS at 300 psi or 600 psi. OEMs and water plants should ask which stream should pass, then match factory QA, certification records, and precision element data to the application the system is engineered to serve.
Pore Size and Ion Selectivity in Nanofiltration
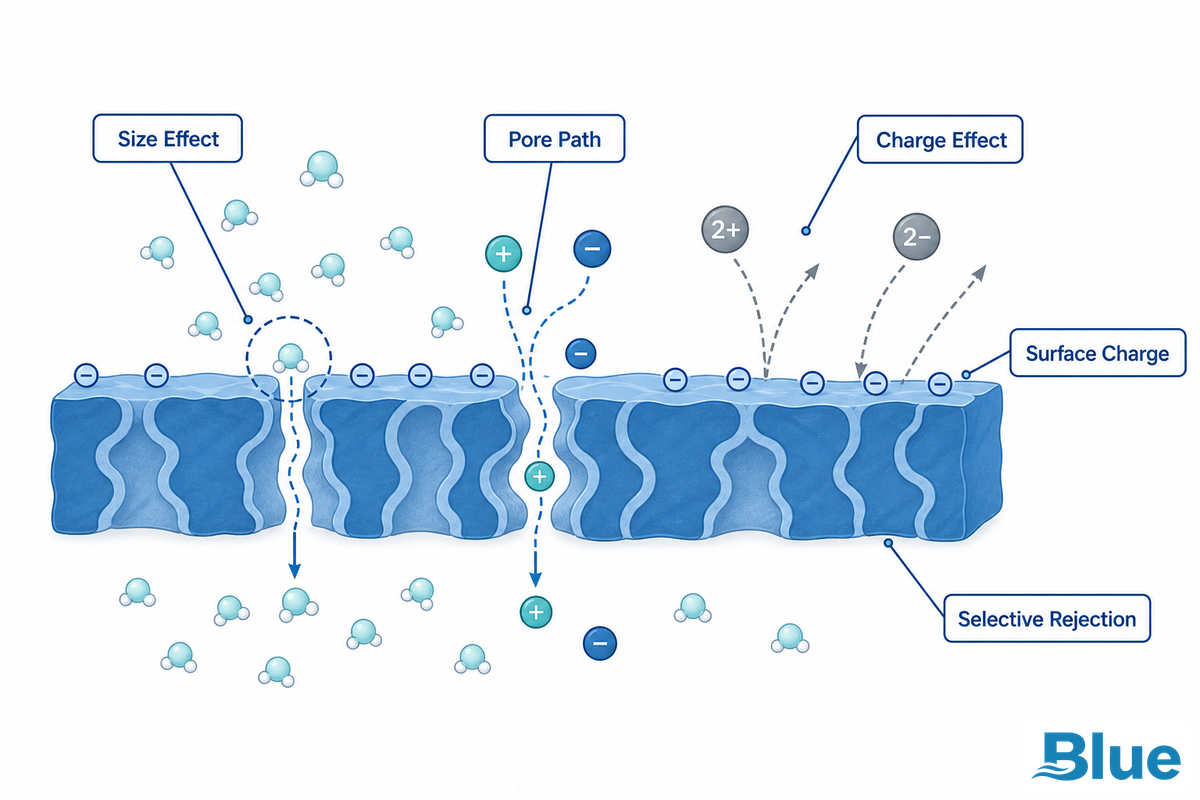
The separation is driven by more than pore size. Size exclusion matters, but charge effects and membrane chemistry also shape retention. That’s why a membrane may show high MgSO4 removal while allowing more NaCl passage. It’s also why the same membrane can behave differently at another pH, another temperature, or another feed blend.
ASTM D4195-23 is useful here because it warns that membrane performance is strongly influenced by feed composition. Retention can change with the ratio of single-charge and multi-charge species and with total concentration; permeate flow can change with temperature, pressure, recovery, and feed chemistry.
Engineering note: do not compare removal without the test recipe
A nominal data point such as 97% MgSO4 removal is only meaningful when the datasheet also states feed concentration, pressure, recovery, pH, and temperature. ISO 25175, listed under publication as Edition 1 in 2026-06, is built around this same idea for RO and nanofiltration membrane element testing.
A buyer faces a hidden problem when pore size alone is used to predict retention, because charge effects can reverse expectations as pH and recovery move. Compare at least two pressure points, such as 100 psi and 150 psi, rather than one snapshot. Factory QA, certification records, and precision coating control matter here because the membrane is engineered to keep selectivity stable across those conditions.
The 4-Stream NF Fit Test
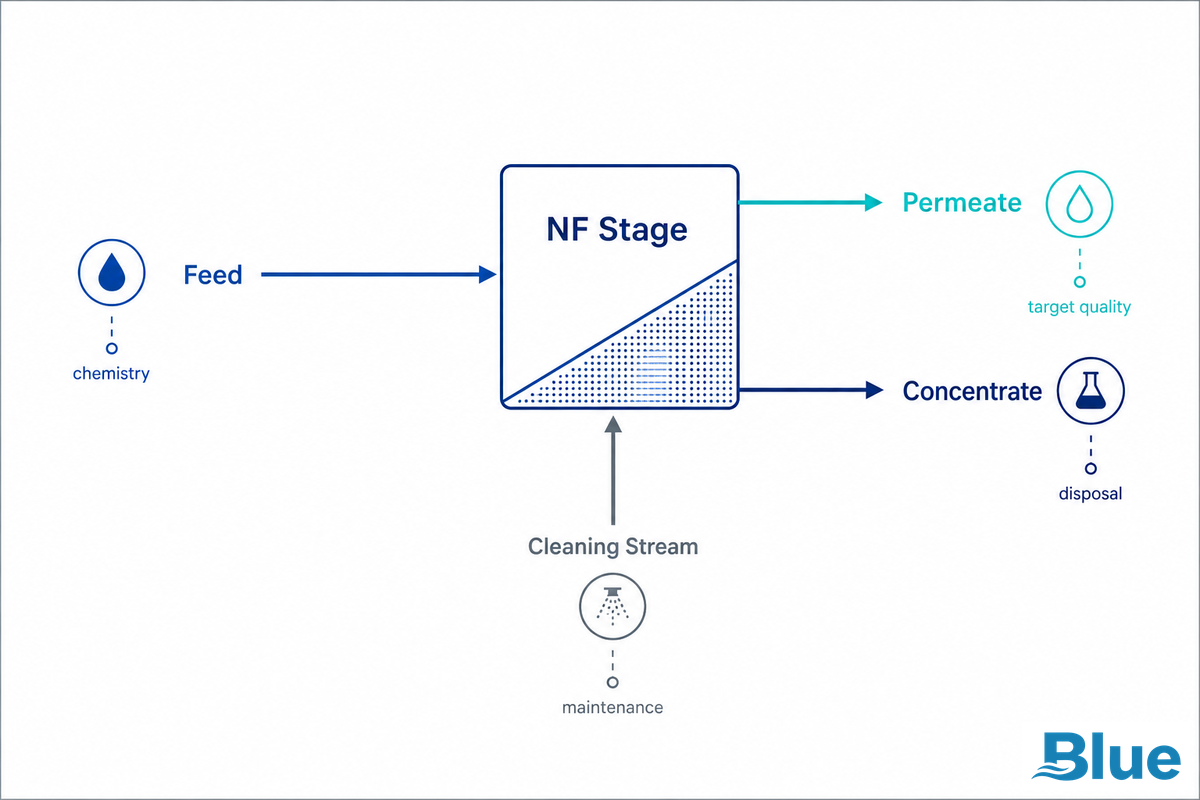
Before selecting an element, map four streams. This is a simple way to prevent a datasheet-only decision.
- Feed stream: hardness, sulfate, organic color, turbidity, oxidants, oil, silica, barium, strontium, temperature, pH, and conductivity.
- Permeate stream: allowed hardness, allowed TDS, product-water use, taste or process-chemistry target, and downstream unit operations.
- Concentrate stream: volume, scale saturation, discharge permit, reuse option, hauling cost, and local disposal rules.
- Cleaning stream: cleaner compatibility, pH exposure, expected cleaning frequency, and waste neutralization route.
EPA notes that RO and nanofiltration processes can reject 15-30% of feed water as concentrate. That number isn’t a side note for inland plants. If disposal is constrained, the concentrate stream can decide whether the process is practical even when permeate quality looks attractive.
Concentrate handling is often the expensive risk, not a footnote. If a water plant rejects 15-30% of feed as concentrate, a wrong disposal assumption can fail the project even when permeate quality passes. Mapping all 4 streams is structural because factory QA, certification records, and precision element data show what the membrane is engineered to tolerate in practice.
Advantages of Nanofiltration in Water Treatment and Wastewater Treatment
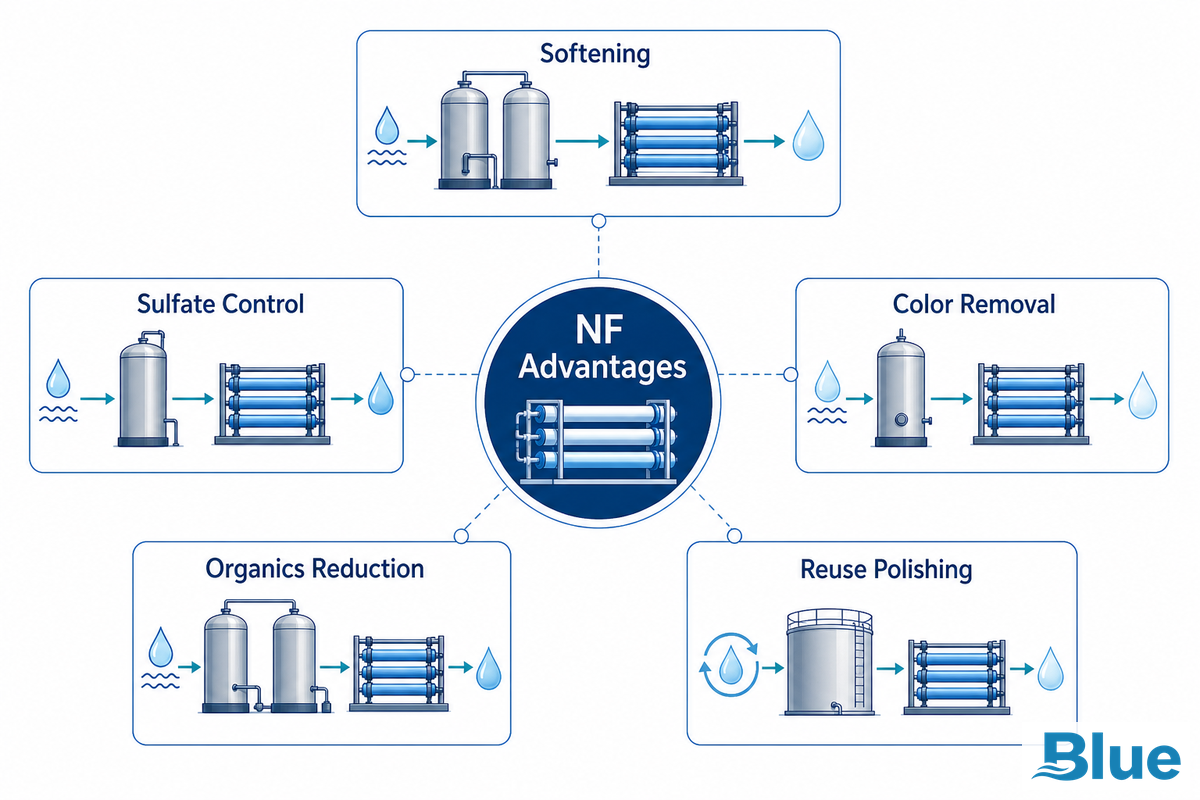
Nanofiltration earns its place when selective removal creates a smaller plant penalty than full desalting. In municipal water, that can mean softening, color reduction, or disinfection byproduct precursor control. In industrial process water, it can mean protecting boilers or process baths without stripping every mineral species. In specialty separation, it can mean retaining higher-value molecules while letting water and selected minerals pass.
Trade press examples show this selectivity in service. According to Water Technology, a Petrobras offshore sulfate-removal pilot used an NF membrane that exceeded a 99.5% sulfate-removal threshold with more than 99.8% sulfate removal during a five-month trial; the tested 8 inch elements had 440 ft2 of membrane area. That’s a sulfate-control case, not a blanket claim for every application.
Industrial buyers rarely face a simple “nanofiltration or not” problem in isolation. Application fit depends on whether a membrane can meet the production target at the required recovery without creating a concentrate risk. Compare the use case at 8 inch element scale or another real module format, then ask for factory QA, certification traceability, and precision records that show the element is engineered to repeat the result.
The Rejection Spec Decoder: 7 Fields Buyers Should Check
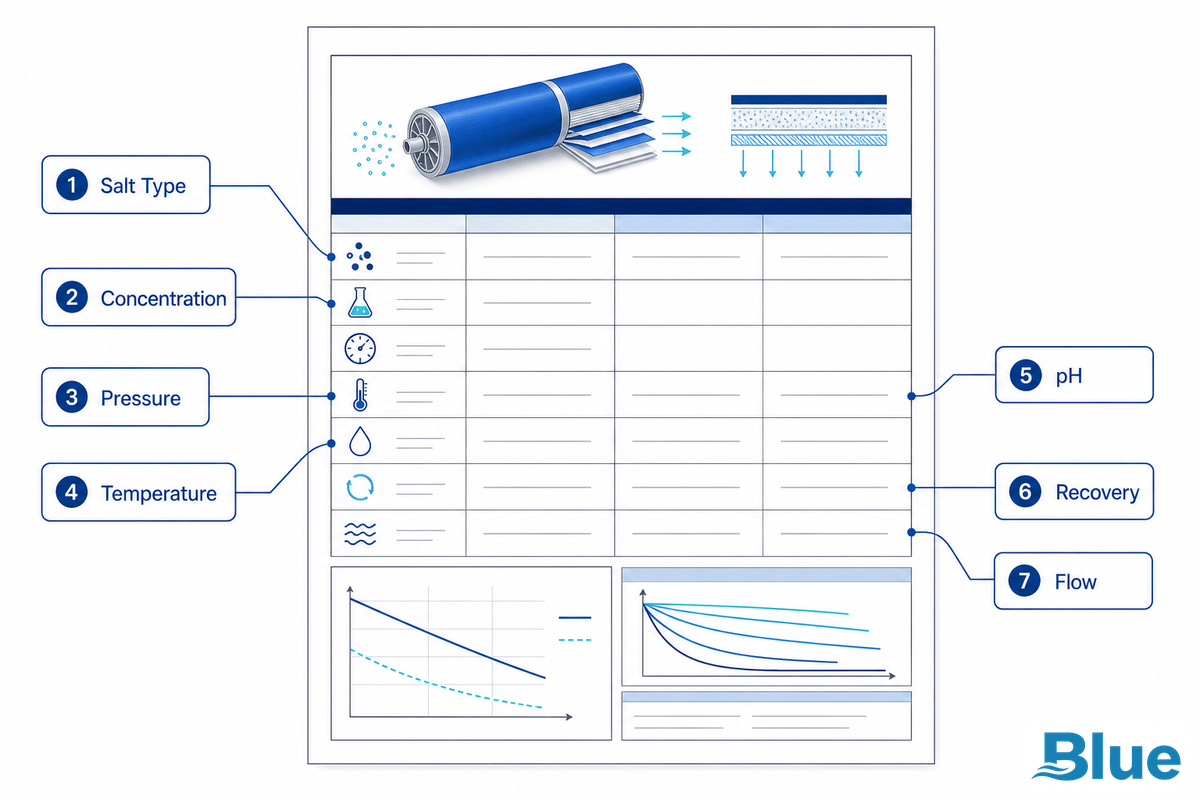
If two membranes list the same removal number, they may still behave differently. Read the spec as a test condition package.
| Field | Why it matters | Procurement question |
|---|---|---|
| 1 – Reference solute | MgSO4, Na2SO4, and NaCl do not read the same. | Which solute was tested? |
| 2 – Concentration | 2,000 ppm MgSO4 is not equal to a lower-strength screening test. | What was the feed concentration? |
| 3 – Pressure | Flow and selectivity shift with pressure. | Was it tested at 100 psi, 150 psi, or another point? |
| 4 – Temperature | Water viscosity changes flow and pressure demand. | Was the rating normalized to 25 C? |
| 5 – pH | Surface charge and solute form can change. | What pH range was used? |
| 6 – Recovery | Higher recovery concentrates scale-forming minerals. | What recovery was used in the test? |
| 7 – Flow | A high removal number can come with lower productivity. | What permeate flow was reported? |
| 8 – Cleaning limits | Chemical exposure defines field recovery after deposits. | What cleaning pH and oxidant limits apply? |
| 9 – Element size | 2540, 4040, and 8040 elements affect vessel count and plant layout. | Which element format matches the skid? |
Blue Membrane’s product page, for example, separates N1/N2/N3 grades and element-format details. That’s the right place to verify the current product specification. At guide level, the broader lesson is that any stated removal value should still be matched against the buyer’s real feed and target recovery.
Spec gaps become project risk when pressure, pH, and recovery are missing. A 97% removal value at 2,000 ppm and 100 psi may not match a production feed at 75% recovery. Request the complete test recipe plus factory QA, certification records, and precision element traceability so the membrane is engineered to the same comparison basis.
Fouling, Pretreatment, and Operating Limits
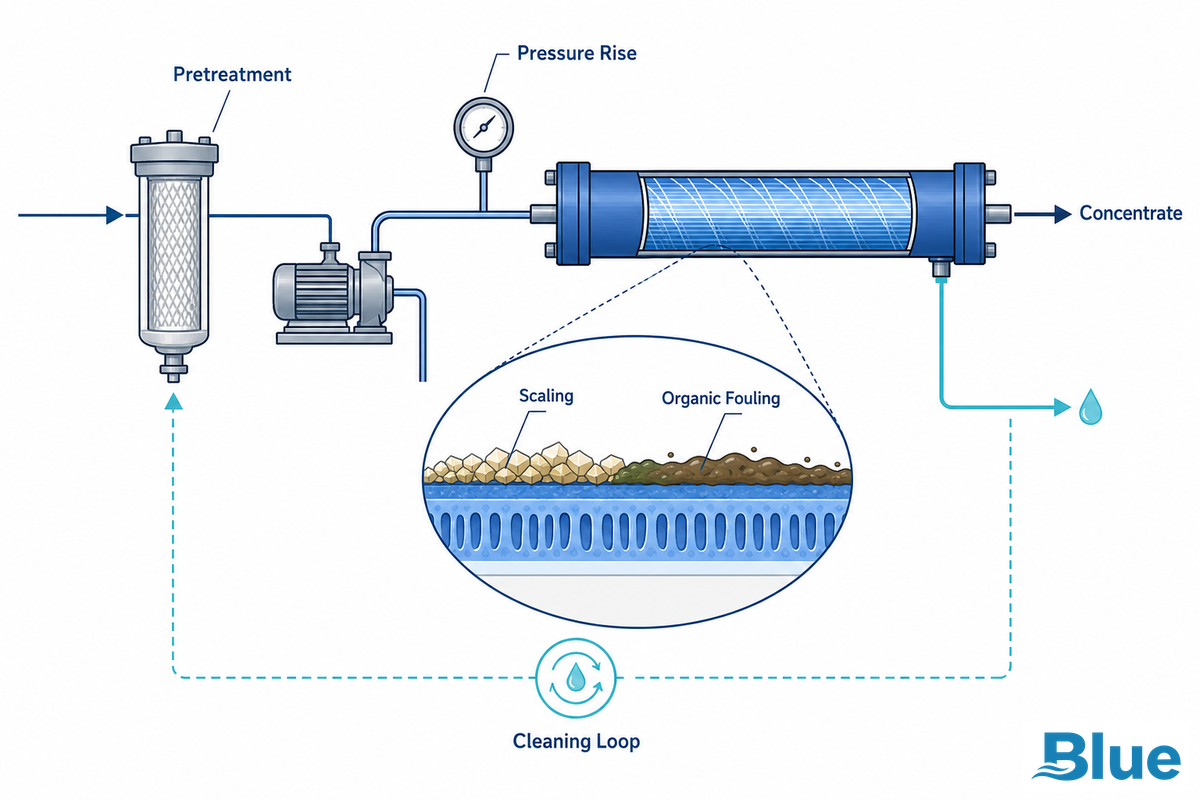
Deposits and scaling are not only maintenance issues. They change the apparent economics of the process by lowering flow, raising pressure demand, and increasing chemical cleaning. EPA notes that pretreatment is needed to prevent plugging or deposit formation. That warning belongs near the start of membrane selection, especially when the feed contains organics, iron, manganese, oil, suspended solids, biological activity, or scaling minerals.
P0-1 review also flagged a useful taxonomy correction: material and module form are different decisions. Polyamide and ceramic describe membrane chemistry or structure. Spiral-wound describes a common element configuration. Strong specification notes keep these separate.
Water plants and OEMs face deposit risk because flux can slip while pressure and cleaning demand rise. A 10 C winter feed, a 30 C summer feed, and a 75% recovery target can produce different scaling and biological-growth behavior. Factory QA, certification records, and precision element construction do not remove the need for pretreatment, but they show whether the membrane is engineered to tolerate the stated cleaning window.
Membrane Manufacturing vs Module Geometry
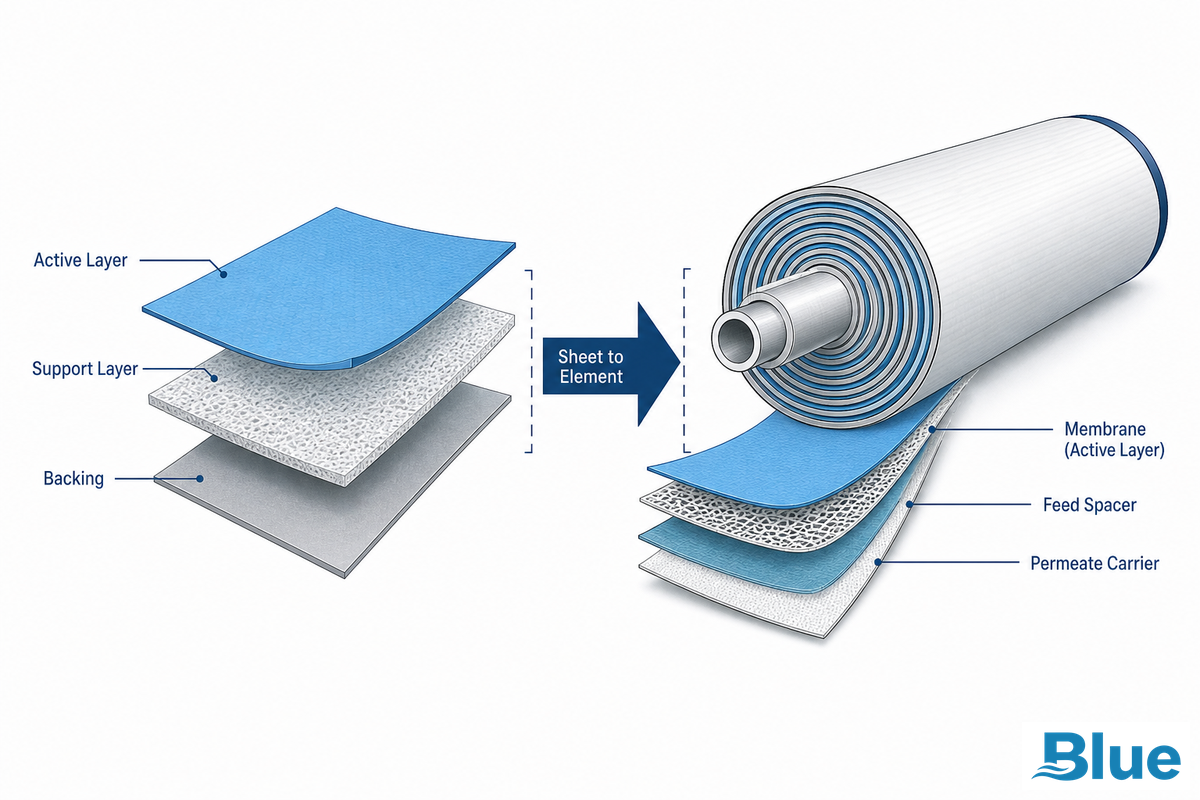
Buyers often mix three different ideas: active layer chemistry, support material, and module geometry. This distinction matters because a treatment skid can use a familiar spiral-wound element format while the real selectivity come from the membrane sheet chemistry and surface charge.
- Thin-film composite polyamide: common in spiral-wound elements for industrial and municipal water duties.
- Ceramic option: considered where temperature, solvents, abrasive solids, or aggressive cleaning may be outside polymer comfort zones.
- Spiral-wound element: a compact module layout, not a membrane material.
- Hollow fiber designs: an area of active development; a 2024 patent record discusses hollow fiber control, water temperature sensitivity, and plugging concerns in rolled membrane systems.
Material selection fails when buyers compare ceramic, polyamide, and spiral-wound as if they are the same category. Structurally, the trade-off is that a polymer membrane may suit a 4040 or 8040 treatment element, while a ceramic module may fit a harsher temperature or cleaning application. Ask for factory QA, certification records, and precision coating or module data because each material is engineered to tolerate a different operating envelope.
Cost, Energy, and Recovery Trade-Offs
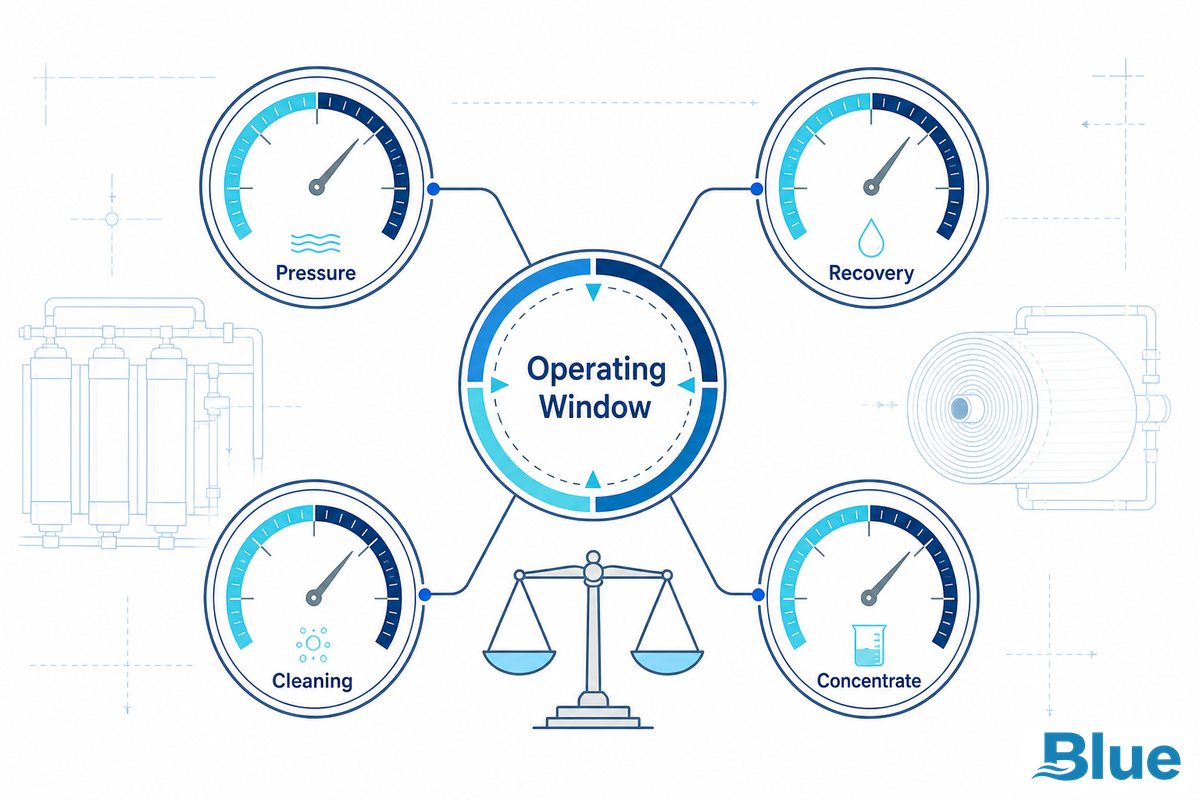
Nanofiltration can reduce pressure and energy compared with full desalting in some duties, but that isn’t a universal guarantee. Water Online describes the process as opening applications where lower energy, mineral or chemical reclamation, and smaller toxic pollutant volumes can make sense. Treat that as an application-fit signal, not a fixed savings percentage.
Plant-level cost has five parts: feed pretreatment, pump energy, element replacement, cleaning chemicals, and concentrate handling. Raising recovery may lower discharge volume, but it also raises scaling pressure in the concentrate. Lowering pressure may save energy, but it can also reduce permeate flow. Sound membrane design normally tests several operating points rather than chasing a single maximum recovery number.
Hidden cost creates a problem because energy, cleaning, replacement, and concentrate disposal move together. Raising recovery from 15% to 75% can lower discharge volume, but the trade-off is higher scale risk and possible flux loss. OEMs and water plants should compare the application at 50 psi, 100 psi, and 150 psi, then request factory QA, certification records, and precision element data before using a budget estimate.
2026 Changes in Nanofiltration Membranes
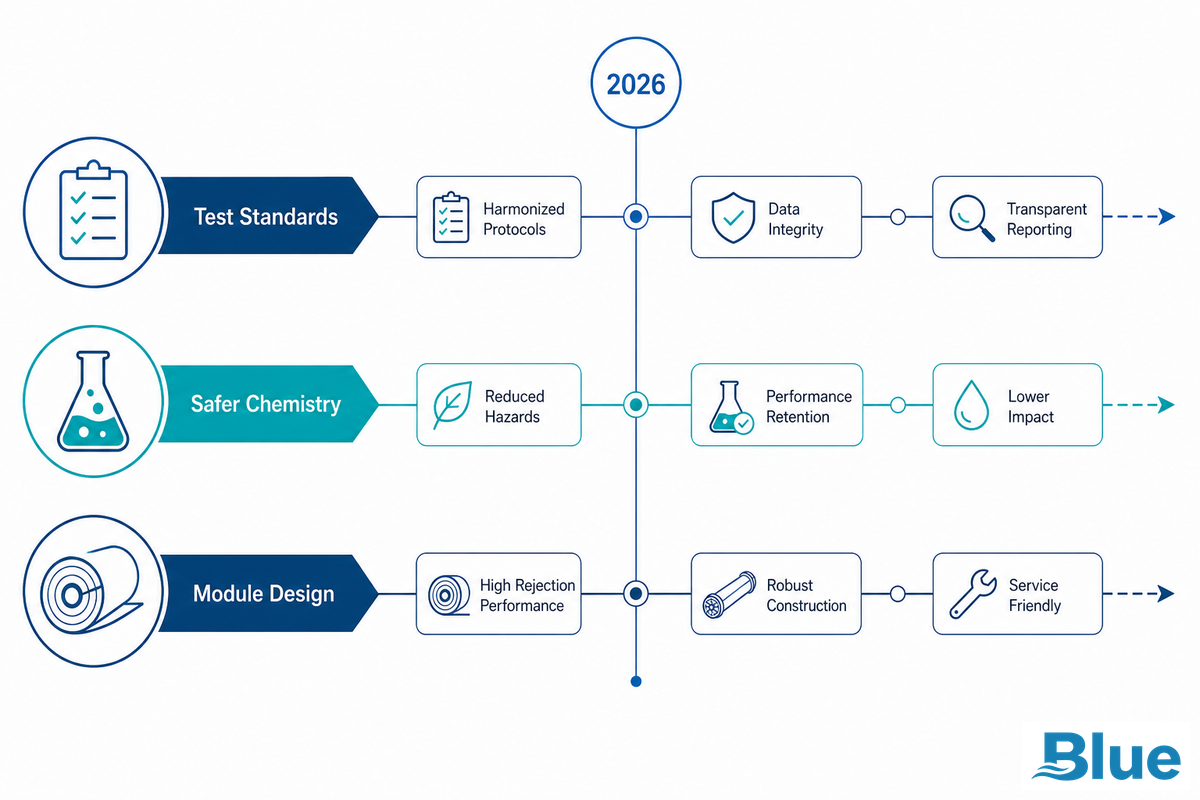
The strongest 2026 trend isn’t a vague market-growth story. It’s the push toward lower-hazard production chemistry, clearer test methods, and better operation under real feed variation. Nature Water published a 2025 article on sustainable production of high-performance nanofiltration membranes and noted that current production can rely on hazardous petrochemical-based chemicals.
Standards are moving as well. ISO 25175 is listed under publication in 2026 as a standard test method for RO and nanofiltration membrane elements. Buyers should treat this as a reminder to ask for normalized test conditions and to keep old datasheets from being compared against newer test conventions without checking the fine print.
Buyers in 2026 need to separate real specification changes from marketing language. ISO 25175 matters because it points the industry toward cleaner comparison of RO and nanofiltration membrane elements, while the Nature Water work highlights production chemistry risk. Industrial buyers should ask whether factory QA, certification records, and precision coating controls are engineered to support the stated 2026 test basis.
How to Choose the Right Nanofiltration Membrane
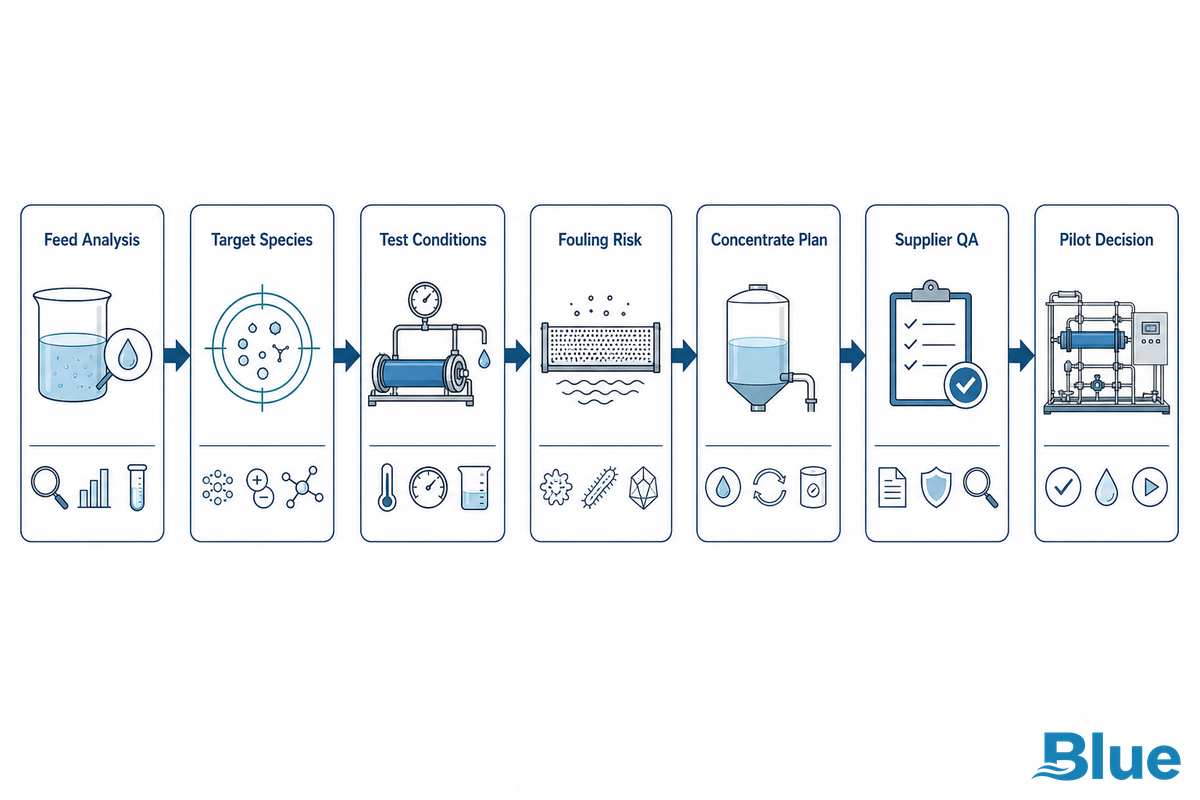
Start with the water, not the catalog. Ask for a complete feed analysis and define the permeate target in measurable terms. Then compare nanofiltration, full desalting, ultrafiltration, ion exchange, and hybrid options against the same feed and recovery assumptions. If the target is selective softening or sulfate control, this process may be the direct path. If the target is broad demineralization, the tighter membrane process will often be the cleaner answer. If the target is only suspended solids, UF or media pretreatment should come first.
Water purification RFQs should name the expected operating band rather than a single best-case point: 50 psi, 100 psi, and 150 psi can tell different stories on the same feed; 10 C water and 30 C water can change viscosity and flow; 15% recovery and 75% recovery can create different scale pressure. Ask for a pressure-normalized curve rather than a single point such as 6 bar, 10 bar, 20 bar, 300 psi, or 600 psi. A useful selection note also names whether the duty targets minerals, organic compounds, color bodies, or a broader purification result.
OEMs and system integrators should include feed analysis, expected recovery, permeate quality target, design temperature range, cleaning philosophy, element size, pressure limits, and concentrate route in the RFQ. That gives the membrane supplier enough context to recommend the right selectivity grade instead of overselling rejection.
One final mistake is asking for the highest rejection grade before the feed analysis is complete. Here, the problem is that a 100 psi softening use case, a 300 psi partial demineralization case, and a 600 psi RO boundary can point to different membranes because each duty has a different pressure and recovery bind. In OEM RFQs, Blue Membrane can review the application basis; buyers should still provide factory QA needs, certification requirements, and precision element constraints so the recommendation is engineered to the real operating window.
RFQ vocabulary check
- Membrane form: clarify whether the supplier is discussing a flat sheet membrane, a rolled element, or a ceramic module; a semipermeable membrane still needs membrane manufacturing controls that protect membrane performance and water permeability.
- Water target: Name water softening, wastewater treatment, partial desalination, total dissolved solids, sodium chloride passage, and magnesium sulfate rejection as separate targets, not one broad purity goal.
- Test report: Keep one salt rejection line that separates monovalent ions from divalent ions; the monovalent/divalent contrast explains why sodium chloride and magnesium sulfate cannot be judged by one percentage.
- Operating window: Ask for operating pressure, temperature, recovery, chemical resistance, and cleaning limits before comparing this option against reverse osmosis membranes or ceramic membranes.
- Plant economics: Include energy consumption, concentrate treatment, replacement interval, and discharge limits in the same RFQ so the membrane choice is judged as a system decision.
FAQ
Is a nanofiltration membrane the same as reverse osmosis?
View answer
No. Both are pressure-driven membrane processes, but the tighter option is normally used for broader TDS reduction. Nanofiltration is usually more selective, with stronger removal of many hardness-forming species and larger organics than of sodium or chloride. In practice, that means it can be a better fit when the system needs softening, sulfate control, color reduction, or partial desalting rather than full demineralization.
How should I read MgSO4 rejection?
View answer
MgSO4 rejection is a useful reference for sulfate and hardness selectivity, but it is not a full system guarantee. It tells you how that membrane behaved under the test recipe used by the manufacturer or test lab. To compare two membranes, you need the feed concentration, pressure, recovery, pH, temperature, and permeate flow. A value such as 97% MgSO4 removal at 2,000 ppm and 100 psi is far easier to judge than a bare percentage because the buyer can ask whether the real feed is harder, warmer, colder, more concentrated, or more scale-prone. Without those details, one rating can look equal to another while hiding a different operating point. This is also why ASTM and ISO test-method language matters: repeatable conditions keep procurement teams from comparing unlike data.
Can nanofiltration remove every mineral from water?
View answer
No. Nanofiltration is not selected for total mineral removal. It can reduce certain species and organics, but sodium and chloride often pass more readily than sulfate or hardness. For high-salinity desalination or broad TDS reduction, the tighter process usually comes first. For partial desalination with mineral passage, nanofiltration may be the better fit.
What are the disadvantages of nanofiltration?
View answer
The main drawbacks are sensitivity to pretreatment, concentrate disposal, selective rather than complete mineral removal, cleaning limits, and feed-specific performance. A membrane that works well on a standard test can lose flow on iron, oil, colloids, biological growth, or scale-forming feed. It also leaves a concentrate stream, so inland projects must check discharge or reuse options before assuming the process is cheaper than alternatives.
Which is better, UF or NF?
View answer
No single choice is universally better. UF is the better front-end barrier when the problem is suspended solids, colloids, bacteria, or turbidity and the mineral balance should stay almost unchanged. NF is selected when the plant needs selective hardness, sulfate, color, or organic reduction. Many systems use UF or media filtration first, then a tighter membrane stage after the feed is protected.
Which feed problems cause NF membrane fouling?
View answer
NF membrane fouling can come from suspended solids, colloids, biological growth, organic matter, iron, manganese, oil, silica, and scaling minerals. The first visible symptom may be lower permeate flow, but the real cost is usually a chain of effects: higher feed pressure, shorter cleaning intervals, more chemical exposure, lower recovery, and less stable permeate quality. A membrane that looks strong in a clean-water or standard test may struggle on a poorly pretreated feed. A practical design normally includes feed screening, cartridge protection, antiscalant review where needed, oxidant control for sensitive polymer membranes, and a cleaning plan that matches the membrane’s pH and chemical limits. Where wastewater reuse or surface water creates seasonal variation, pilot testing gives a better warning than a one-time lab analysis.
When should I ask for pilot testing?
View answer
Ask for pilot testing when the feed is variable, when organic color or reuse chemistry drives the project, when concentrate disposal is costly, or when the buyer plans to run at high recovery. A bench or pilot test can show flow decline, cleaning response, permeate quality, and scale risk under real feed chemistry. It also helps compare looser grades, tighter grades, and full desalting on the same operating basis.
References Used
- EPA – Overview of Drinking Water Treatment Technologies
- Texas Water Development Board – Membrane filtration chapter
- ISO 25175 – membrane element test methods
- ASTM D4195-23 – water analysis for membrane applications
- Water Technology – Petrobras sulfate-removal pilot
- Water Online – nanofiltration process applications
- Nature Water – Sustainable NF membrane production, 2025
- Google Patents – Hollow fiber NF membrane system control