Get in touch with Blue Membrane Company

Brackish Water RO System Design for Fouling-Prone Feed

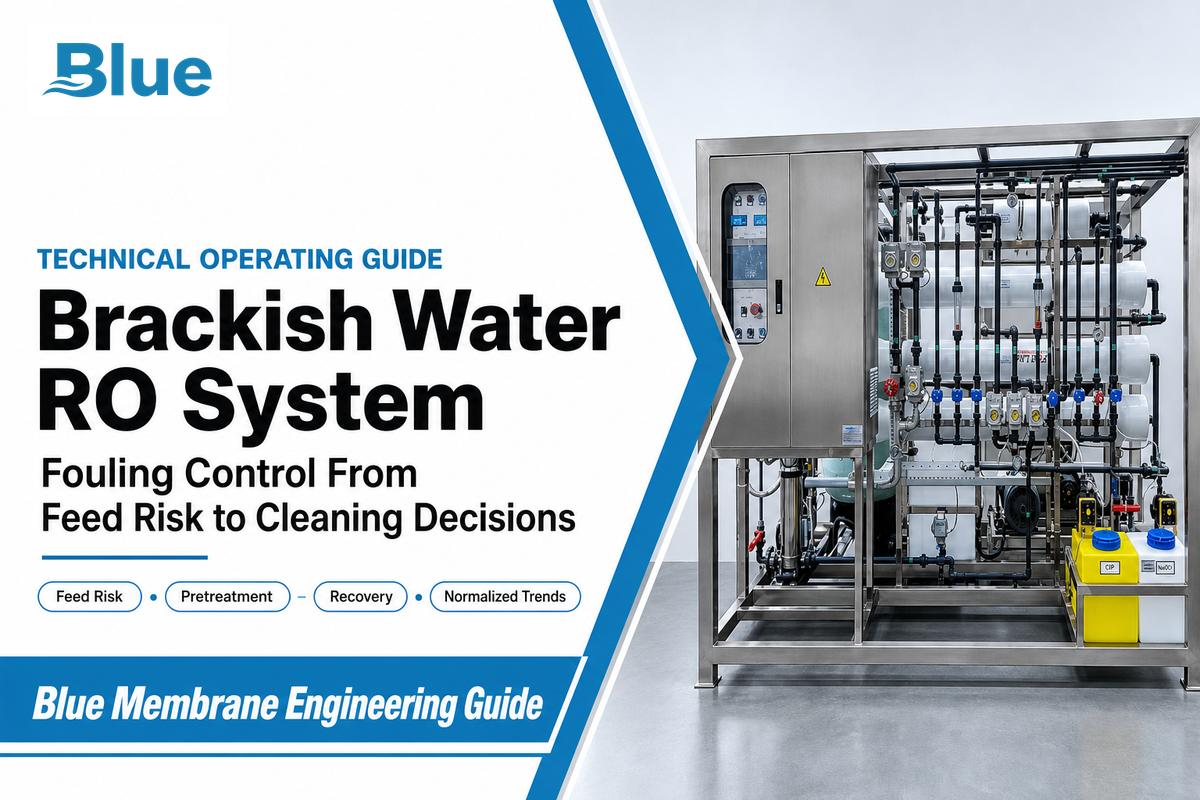
Technical operating guide
A brackish water RO system is a pressure-driven treatment train that begins with a feed-risk map, not a TDS number. Match up feed with the deposit mechanism, set recovery from saturation limits, and track normalized performance before deciding whether to adjust the process or to clean the membranes.
Technical review note: this guide was prepared for plant designers and operators and reviewed against government, peer-reviewed and current membrane-supplier sources. Site water analysis, the installed element manual, and local requirements remain controlling.
TDS Does Not Define Fouling Risk
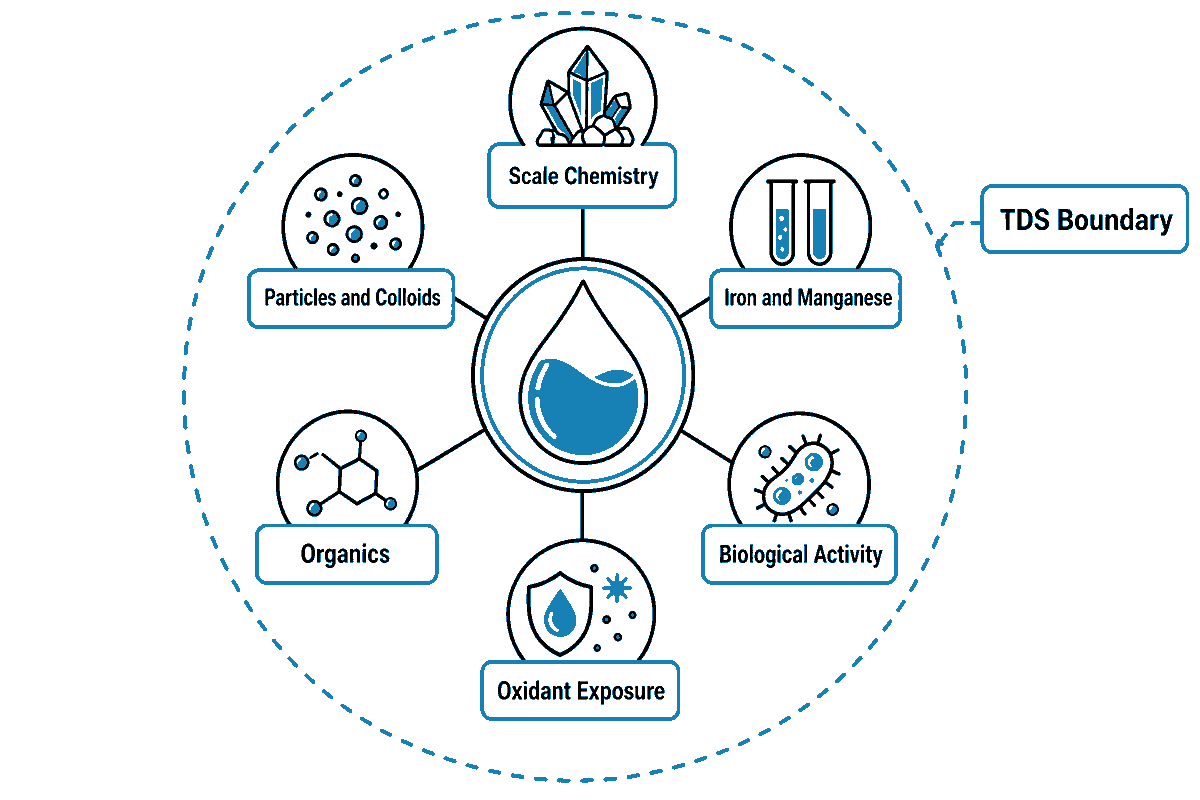
Brackish water reverse osmosis separates dissolved salts under pressure, but salinity is only one design variable. That operating boundary is why the feed-risk map, rather than TDS alone, governs fouling control. Two wells with comparable TDS can cause very different problems. The one with silica and hardness will behave very differently from a well with iron, organics, colloids, or biological activity.
The U.S. EPA treatment overview notes that RO frequently needs pretreatment to prevent fouling or plugging and also creates a concentrate stream that must be managed; its overview describes concentrate at roughly 15–30% of feed for the standard designs discussed. A U.S. Bureau of Reclamation study defines brackish water in its scope as 1,000–10,000 mg/L TDS and makes the wider design point through data: one well with 1,940 mg/L TDS also contained 17.9 mg/L nitrate, while the report tracked silica and other constituents beside salinity. TDS describes the salt load; it doesn’t identify what deposits, grows, oxidizes or passes through the membranes.
Design rule: classify salinity, scaling potential, suspended matter, metals, organics, biology, temperature, and oxidant exposure separately. Then test the seasonal or operating extreme, not only one convenient grab sample.
| Design input | What it can change | Minimum useful record |
|---|---|---|
| TDS and major ions | Osmotic pressure, rejection, concentration | Complete ionic analysis with charge-balance review |
| Hardness, alkalinity, sulfate, silica | Mineral saturation as recovery rises | Worst-case chemistry and temperature |
| Iron and manganese | Oxide deposits and catalyst effects | Dissolved and total values, oxidation state context |
| Turbidity and particles | Colloidal loading and lead-stage pressure drop | Trend plus a suitable fouling index |
| Organics | Adsorption, biofilm substrate, cleanability | Representative organic-carbon indicator |
| Biological activity | Biofilm initiation and regrowth | Source-specific microbial indicator and trend |
| Temperature | Permeate flow and normalized performance | Daily value and seasonal range |
| Oxidant and reducing agent | Polyamide integrity or downstream regrowth | Residual at the membrane feed and dosing record |
| pH | Speciation, saturation, cleaning selection | Calibrated online trend plus laboratory checks |
Scope and terminology
Within a water treatment plant, reverse osmosis technology is one of several membrane technologies. A complete brackish water treatment process may draw raw water or sea water from different sources; for brackish service, industrial water and municipal water treatment goals can include drinking water purification, freshwater production, or additional water treatment before a municipal water supply.
To purify brackish water safely, define treatment needs from the full feed analysis and the intended high-quality water use. This is the basis for treating brackish water, improving water quality, protecting water resources, and selecting a system that can purify brackish water sources.
Inconsistencies in industry terms make translation challenging. A BWRO system is a variation of the reverse osmosis system for the treatment of feed water. Brackish water reverse osmosis systems are a class of water treatment systems. The terms brackish water treatment, brackish water desalination, and brackish groundwater desalination, and groundwater reverse osmosis desalination, among others, may define a complete treatment process, not just the membrane stage. An RO plant may also include intake, pretreatment, pumping, concentrate treatment, post-treatment, and storage.
The reverse osmosis process uses applied pressure to drive water through a semi-permeable membrane against natural osmotic flow, while retaining much of the dissolved load. It is used to treat water with salt from selected brackish water sources. Seawater desalination operates at a different salinity and pressure range. The expression “reverse osmosis brackish” is sometimes found in public searches, but does not define an engineering standard.
Its uses are diverse, from treating industrial brackish water to potable water, from augmenting process water and fresh water to purified water and water supply, to brackish water used in different processes, to water treatment used before other processes. “Clean water,” “safe water,” “high quality water,” and “reverse osmosis water” are not the same. The water quality determines what treated water is to be guaranteed.
Reliable water purification therefore begins with the actual water source and treatment requirements. Water purification systems that treat brackish water must address local water-quality challenges, concentrate disposal, and system operation. Labels such as advanced brackish water reverse osmosis, RO desalination, or sophisticated water treatment do not remove the burden of proof. Sound water research, including peer-reviewed journal studies, helps the water treatment industry address water quality and water scarcity challenges and assess water solutions. This guide explains how to treat brackish water through a controlled brackish water treatment process; it does not suggest that one configuration can satisfy every application.
Key takeaway: salinity defines the desalination problem, constituents drive fouling control.
“Reverse osmosis can remove salts from brackish water or seawater.”
U.S. EPA
Build a Feed-to-Failure Matrix Before Choosing Pretreatment
A matrix called “feed-to-failure” links an observed feed signal to a likely membrane failure mode, control action, and verification/validation. That constituent-by-constituent view turns the salinity boundary into a practical feed-risk map. This matrix helps avoid a common engineering error: including a piece of equipment in a water package because it’s standard rather than because it’s needed to treat water.
| Feed signal | Likely risk | First control to evaluate | How to confirm |
|---|---|---|---|
| Hardness plus carbonate alkalinity | Carbonate scale | pH control, antiscalant, or softening | Saturation model at planned recovery |
| High sulfate with calcium, barium, or strontium | Sulfate scale | Recovery limit and compatible scale control | Ion analysis and supplier projection |
| Reactive silica | Silica deposition | Recovery and pH boundary; dedicated pretreatment where justified | Temperature-aware projection and deposit analysis |
| Oxidizable iron or manganese | Metal-oxide fouling | Controlled oxidation and upstream removal | Dissolved/total metals before and after treatment |
| Variable turbidity or colloids | Lead-stage plugging | Coagulation/clarification or membrane pretreatment | Turbidity, particle count, fouling-index trend |
| Natural organic matter | Organic adsorption and biofilm substrate | Source-specific organic removal | Organic-carbon trend and deposit characterization |
| Microbial regrowth after dechlorination | Biofouling | Residence-time, sanitation, and nutrient control | Biological indicator plus lead-stage inspection |
| Coagulant residual | Dense mixed fouling layer | Dose/residual control and filter verification | Residual metal and deposit composition |
| Fine media or carbon carryover | Abrasive or particulate load | Backwash/rinse correction and guard filtration | Particle microscopy and pressure-drop location |
| Oxidant breakthrough | Polyamide damage | Compatibility review and verified dechlorination | Oxidant residual, salt-passage trend, membrane inspection |
Use the matrix as a hypothesis list, not as a substitute for testing. A rising first-stage pressure drop may fit colloidal or biological loading, but the same signal cannot identify the deposit alone. Position in the array, feed chemistry, pretreatment residuals, cleaning response, and, when necessary, autopsy or deposit analysis determine the cause.
For detailed information regarding upstream control trains, see Blue Membrane’s industrial RO pretreatment guide.
Key takeaway: Each pretreatment step should have a named feed risk, monitored control point and confirmation method.
Pretreatment Must Match the Foulant, Not the Sales Package
Pretreatment is a control system, not a fixed equipment sequence. The right train may include oxidation and filtration for iron, clarification or UF for colloids, softening or antiscalant for scale control, a carbon filter or other steps for organics, and cartridge protection and disinfection. Treatment steps selected should be commensurate with what each step creates or removes.
That last point matters. Coagulation can help remove particles, but the residual coagulant can move the problem downstream. A 2026 open peer-reviewed study found that residual iron and aluminum changed the fouling layer and worsened RO performance under the tested conditions. Iron deposition reached 295 μg/cm² by day 6; the mean layer thickness was 76.2 ± 19.7 μm in the iron condition and 13.4 ± 7.1 μm in the control. The important point is to adjust the dose, separation performance, and metal residual in the feed water to the RO.
Control of scale formation also needs a biological boundary. Scale-control polymer use can impact biofilm behavior, so select the dose using the full feed and downstream biology. So, the dose should be based on the full feed and downstream biology. Oxidant control creates a different tradeoff: protect the membrane from an incompatible oxidant while managing the downstream nutrient-bearing zone to prevent regrowth. Record oxidant and reducing-agent residuals, time, and shutdowns.
- Remove unstable solids upstream. Don’t request a cartridge filter to replace clarification or membrane pretreatment.
- Control scale at the planned recovery. Confirm the chemical program is designed for the actual ion set, pH, and concentration.
- Verify residuals. Coagulant, oxidant, reducing agent, and nutrient residuals in the feed can impact RO performance.
- Protect shutdowns. Stagnant, warm, nutrient-rich water can undo otherwise sound continuous-operation control.
Key takeaway: Assess the side effects of each chemical pretreatment and separation at the membrane feed as well as at the dosing point.
Set Recovery Against Saturation and Crossflow Limits
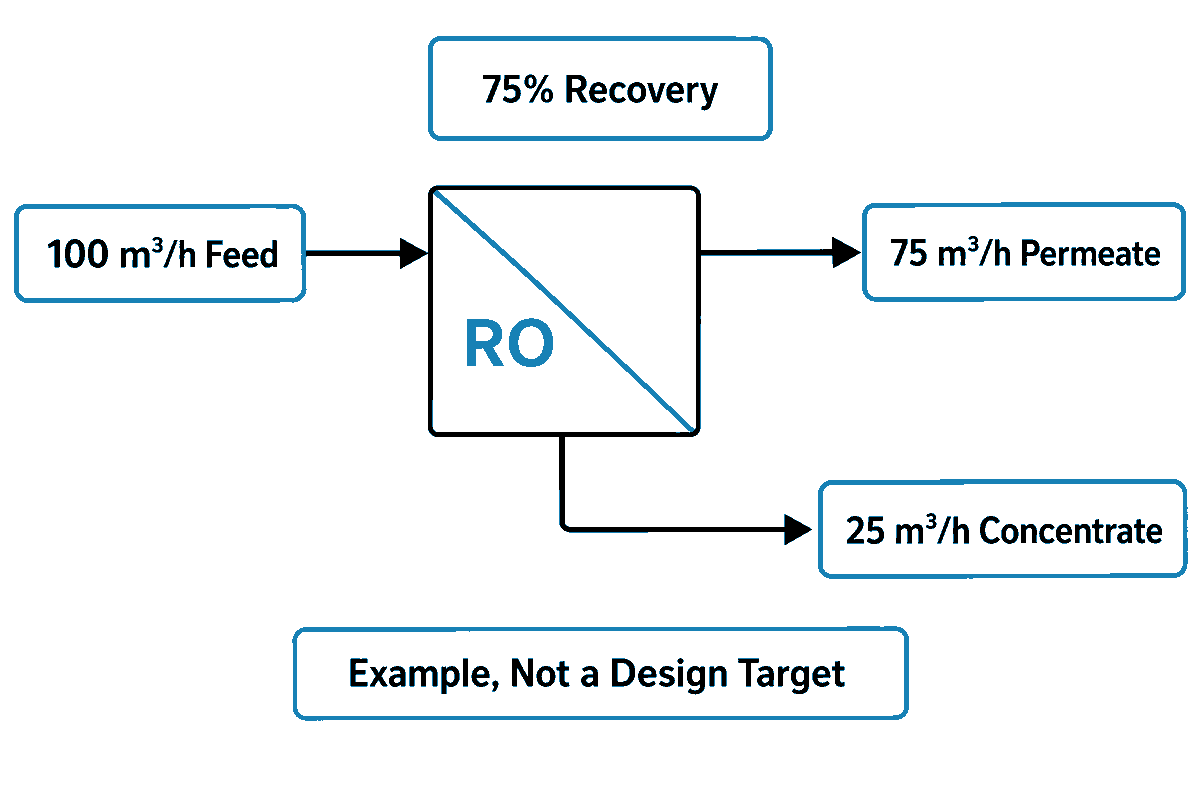
Recovery is the ratio of permeate flow to feed flow. After pretreatment controls the incoming foulants, recovery becomes a scaling risk because it determines how strongly the remaining load is concentrated before routine inspection can find a deposit. Increasing recovery increases the rate of permeate produced, but it also concentrates the rejected constituents and can result in changes in hydraulic conditions in the system, e.g. mineral saturation and concentration polarization. Also, the increased recovery can make the burden on tail elements greater.
The correct recovery is a result of a model and/or a test. A Bureau of Reclamation case used 75% recovery for its specific water and configuration; that is evidence of a design choice, not a universal BWRO target. To ensure the rationale is correct, include the seasonal worst case, element/vessel limits, and verify the results during commissioning. If the feed chemistry moves outside the model, reduce recovery or alter the pretreatment before the membrane becomes the alarm.
Recovery (%) = permeate flow ÷ feed flow × 100
Use calibrated flows recorded during one stable operating state; never compare a raw percentage across different temperatures, pressures, or staging.
Use calibrated flows recorded during one stable operating state; never compare a raw percentage across different temperatures, pressures, or staging.
For a simple mass-balance example, 100 m³/h of feed at 75% recovery produces 75 m³/h of permeate and 25 m³/h of concentrate before accounting for any separate losses. Those flows illustrate the equation; they are not a recommended plant setting.
Key takeaway: Recovery should be determined by feed modeling and array design, and not by a sales specification.
When Fouling-Resistant RO Elements Help
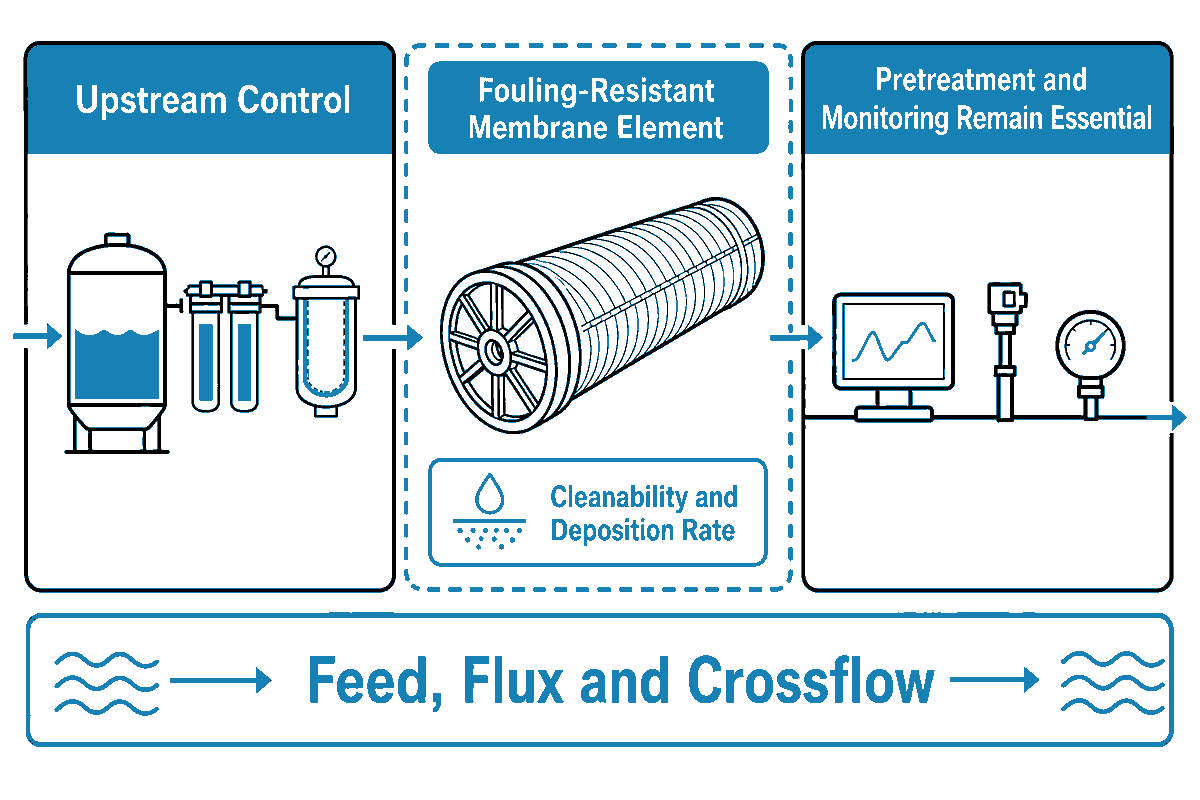
A fouling-resistant membrane element may be useful once upstream control has reduced the load to a manageable level, especially where organic or biological adhesion remains a credible risk. Design and surface chemistry of elements may affect cleanability and/or deposition rate, but the effect is confined to the feed, flux, and crossflow of the membrane element.
It cannot neutralize mineral saturation, oxidant attack, poor vessel hydraulics, media carryover, or uncontrolled biological growth. For example, Patent US11027240B2 describes an electrically assisted spacer, and provides lab data; however, it defines a research direction rather than a commercial one.
Consider the site’s feed and operating envelope before element selection. The claims regarding fouling-resistant RO membrane elements on the fouling-resistant ro membrane elements page of Blue Membrane should be read as they are written and construed within the feed limits discussed in this guide. For further element comparison, consult the Brackish-water RO membrane elements guide.
Key takeaway: An FR element is a resilience choice within a controlled treatment train, not an excuse to forgo pretreatment or monitoring.
Normalize Performance Before Diagnosing Fouling
Raw permeate flow, pressure and conductivity change when feed temperature, salinity, pressure and recovery change. Once the element and operating envelope are selected, normalized data makes drift visible, but operators should inspect sensor tags and calibration records before treating a shift as membrane fouling. Comparing the current raw value to the raw value a month earlier can give a false sense of security or mask a real deterioration in performance. Normalization transforms raw plant data to common references so a change in data is more likely to be attributed to the membrane element rather than a shift in operating condition of the plant.
Establish a baseline after the system reaches a stable operating condition. Record feed, permeate, and concentrate flows; feed and permeate conductivities; stage feed and concentrate pressures; temperatures; pH; recovery; active element count; and the arrangement of vessels. Record the state of pumps, identity of instruments, pretreatment conditions, calculation methods, and the version of the software or spreadsheet. The result of the calculation may be normalized, but the inputs must be recorded.
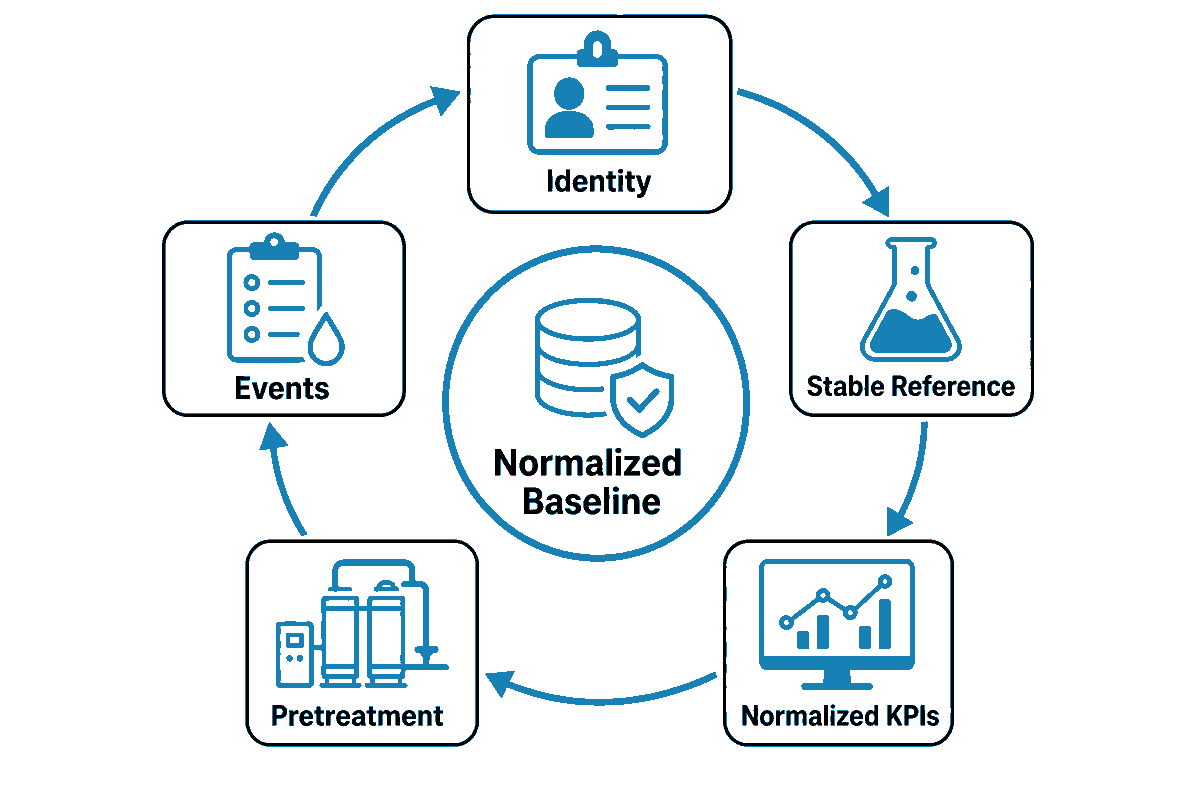
30-Day Baseline Card
- Identity: element model, lot or serial designations, vessel staging, and the latest revision of the supplier’s manual.
- Stable reference: Median values from a week documented as stable, not the best single hour.
- Normalized KPIs: permeate flow, salt passage, and stage differential pressure.
- Pretreatment: Fouling index, filter differential pressure, residual metals, chemical dose, oxidant/reducing residual, and Biological Indicator.
- Events: Shorter-term shutdowns, flushes, sanitation, cartridge/filter changes, chemical changes, and cleanings.
The same data foundations also support membrane selection and replacement decisions. Consult Blue Membrane’s ro membrane replacement guide if irreparable damage, mechanical failure, or exhaustion of cleanability is suspected.
Key takeaway: Normalize, and then analyze the pattern in the context of the stage and pretreatment.
Use Three Normalized Trends to Screen, Not Diagnose, Fouling
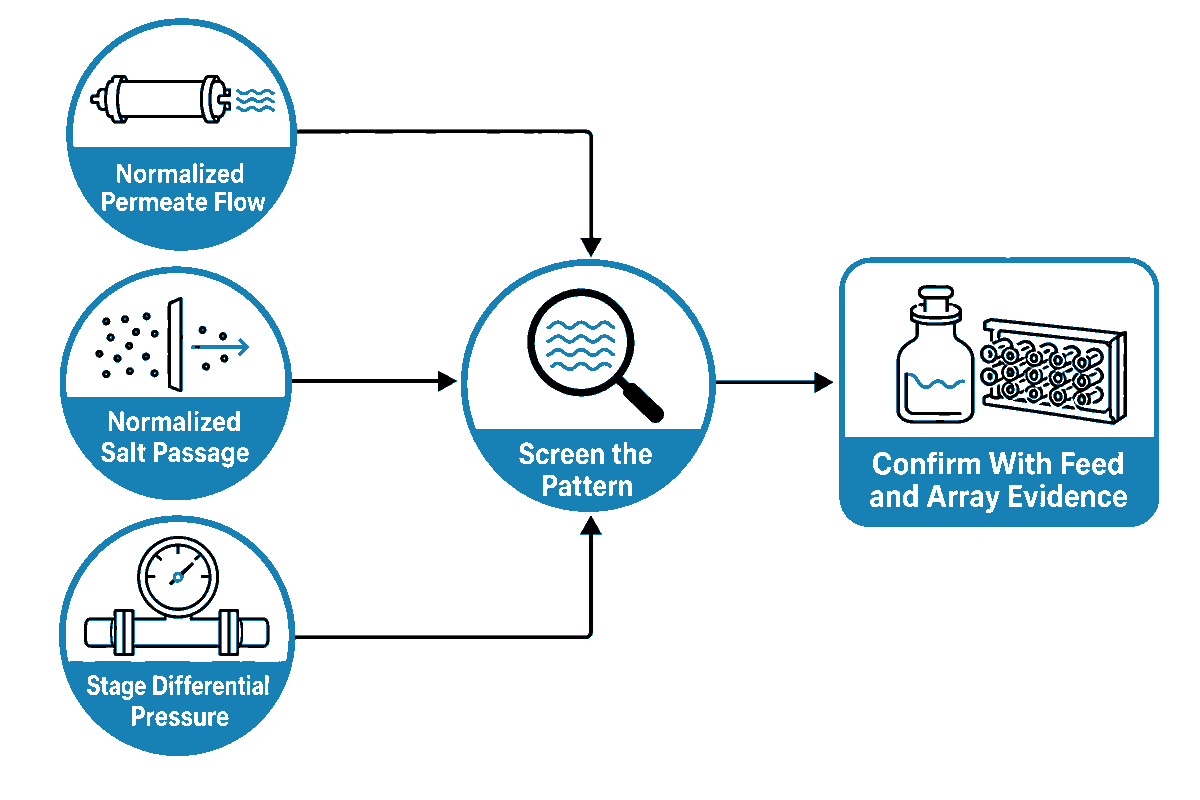
With a stable normalized baseline, the Three-Trend Fouling Screen uses normalized permeate flow, normalized salt passage, and stage differential pressure as a screening set. Each variable represents a different aspect of the problem, and none is exclusive to one foulant. Full-scale biofouling research has shown that normalized pressure drop can be too insensitive for early detection and can rise for non-biological reasons. Treat normalized pressure drop as a route to the next test, not a verdict.
| Observed pattern | What it may indicate | Check next | Do not conclude yet |
|---|---|---|---|
| Flow down; salt passage steady; lead-stage ΔP up | Particulate, colloidal, or early biofilm load | Pretreatment trend, vessel position, deposit sample | That the foulant is biological |
| Flow down; salt passage steady; tail-stage stress | Scaling or concentration-polarization problem | Ion balance, recovery, pH, temperature, projection | That more antiscalant will solve it |
| Salt passage up; ΔP little changed | Oxidation, mechanical damage, seal leak, or operation shift | Oxidant record, probing, vessel inspection, normalization inputs | That cleaning is the first action |
| All three worsen after feed event | Mixed deposit or pretreatment breakthrough | Event timeline, cartridge/deposit analysis, staged profile | That one chemical is enough |
| Raw flow down; normalized flow steady | Temperature or operating-condition change | Sensor calibration and normalization inputs | That the membrane is fouled |
| ΔP rises only in one stage | Localized loading or hydraulic restriction | Stage and vessel profiling | That the whole array needs identical treatment |
| Biological indicator rises before KPI change | Possible early biofilm development | Site-specific bio-monitoring plan and lead-stage evidence | That performance thresholds should be awaited |
| KPI step-change after calibration work | Instrumentation or data-boundary issue | Raw tags, units, scaling, timestamp alignment | That the membrane changed instantly |
| Flow recovers but salt passage remains high after cleaning | Deposit removed but integrity or seal issue remains | Probing, vacuum/pressure tests where applicable, inspection | That cleaning was fully successful |
An industrial case study published in 2026 reported a 15–20-day warning window using multivariable analysis. It is a useful case study showing that an earlier warning time was obtained at that facility; however, it is not a transferable alarm limit. The variables, lag time, and thresholds should be recalibrated for each plant.
Key takeaway: the three multivariable trends focus the investigation, while other data, e.g. feed water, array position, biological evidence, deposit analysis, and cleaning response, explain the cause.
Set Supplier-Specific Cleaning Triggers, and Watch Biofouling Earlier
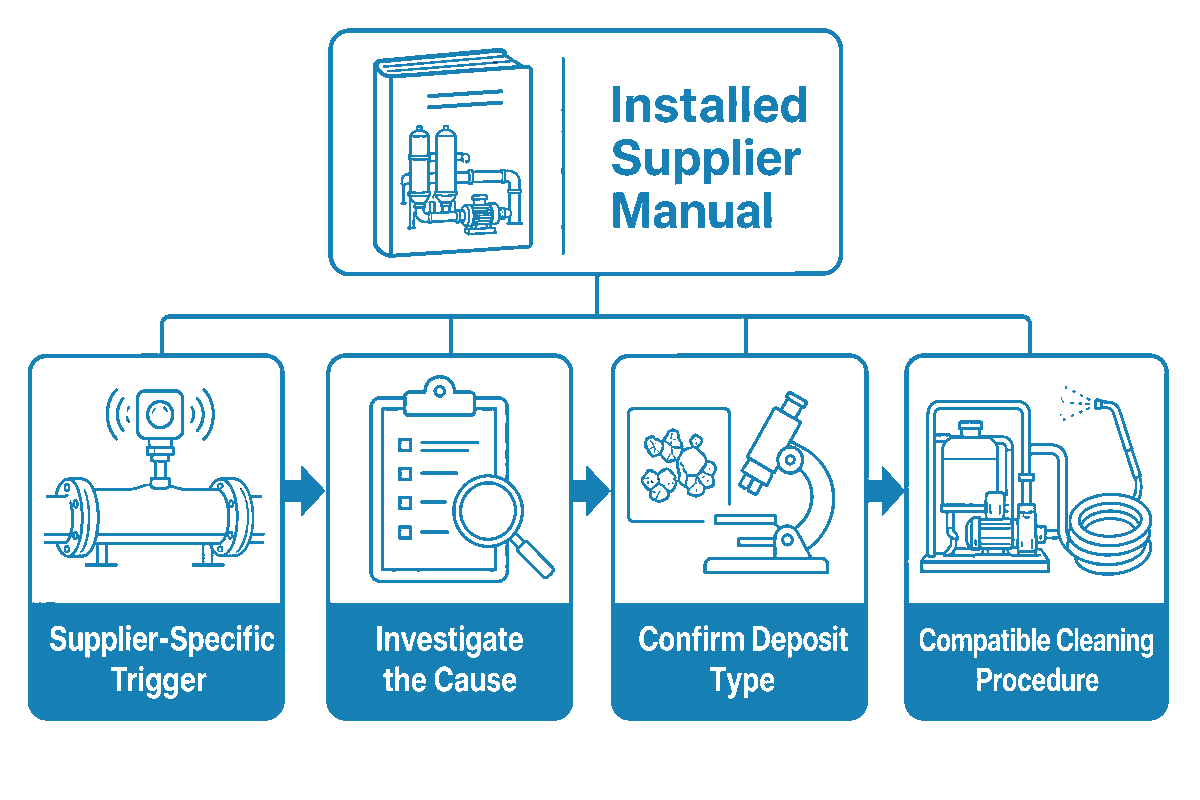
Using another supplier’s percentages creates a mismatch risk, so do not mix cleaning percentages from different suppliers into one rule. DuPont’s FilmTec cleaning guidance gives examples around a 10% normalized permeate-flow decline, a 5–10% normalized salt-passage increase, and a 10–15% normalized pressure-drop increase. Toray’s April 2026 handling manual uses more than a 10% normalized flow decline, but its cited decision table uses more than 20% for normalized differential-pressure rise and more than 20% for normalized salt-passage rise. Each set belongs to the named supplier, membrane family, current manual, and site baseline.
Performance triggers use the core trends, membrane compatibility, and other constraints to decide when to investigate or clean. They answer when to investigate/clean, and not what chemical to use. Select an appropriate sequence for confirmed/supported deposit type, membrane compatibility, temperature and pH limits, handling and disposal constraints, and other controls. Record initial conditions, each step, soak and circulation time, return condition, rinse and normalized performance.
Biofouling should be addressed earlier. Waiting for significant performance decreases can make adhesion more permanent. Where a site has a validated biological indicator, use that evidence in conjunction with lead-stage sampling and operating history. Preventative measures don’t always require a chemical clean and can be addressing nutrient ingress, residence time or sanitation, or dechlorination control.
Safety boundary: cleaning chemistry, neutralization, discharge, confined-space controls, and personal protection are site procedures for qualified personnel. Use the installed membrane supplier’s current manual and each chemical SDS.
Key takeaway: Supplier thresholds drive the membrane; early biological indicators can validate process correction before those thresholds are crossed.
A 30-Day Commissioning and Monitoring Plan
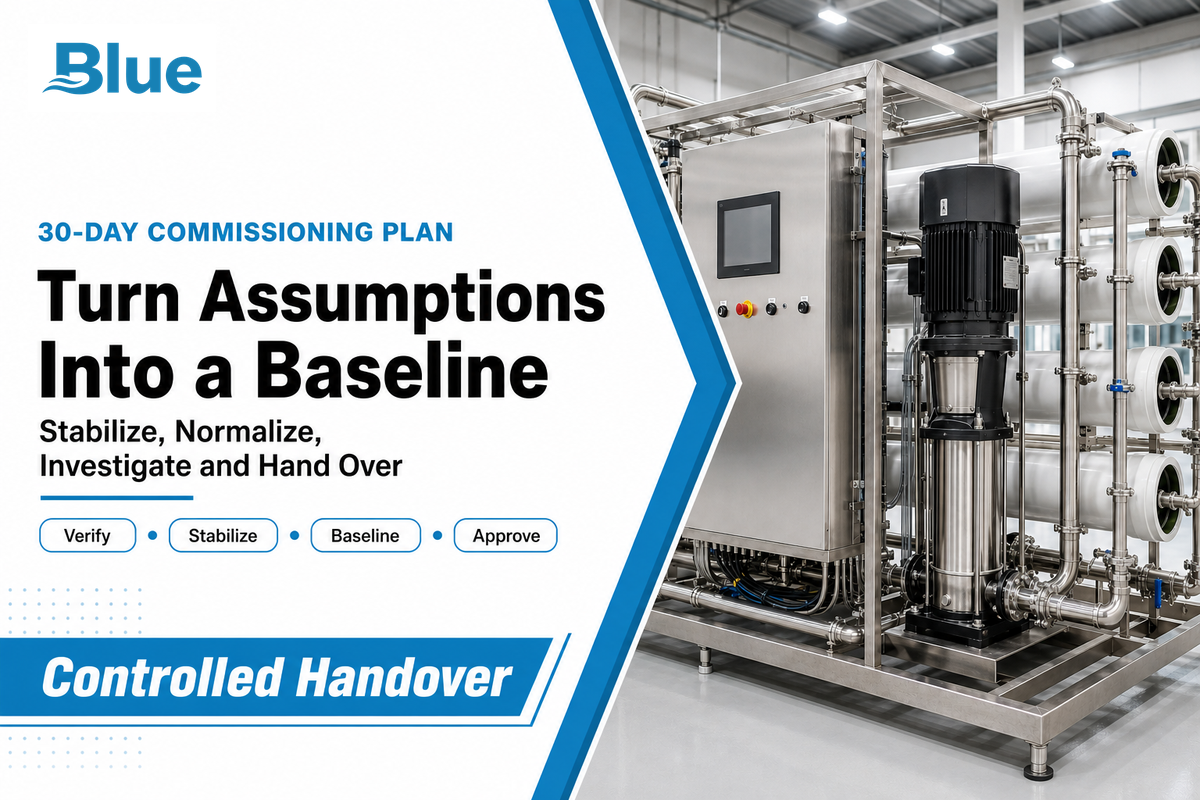
The first month is to turn design assumptions into an operating baseline. Those supplier thresholds and early biological indicators belong in the commissioning response matrix because a failed calibration creates a handover risk before inspection or acceptance. The aim is not to prove that the system can run for 30 days. It is to show which inputs are stable, which are drifting, and what action follows each signal.
| Time | Required action | Evidence to retain | Decision output |
|---|---|---|---|
| Before start | Freeze feed analysis, model, element, array, and manual revision | Approved design basis and document versions | Known operating envelope |
| Day 0 | Verify instrument calibration, tag names, units, and sampling points | Calibration records and data map | Trusted measurements |
| Day 0–1 | Confirm flush, preservation removal, and chemical residuals | Startup checklist and samples | Safe initial condition |
| Days 1–3 | Stabilize flows, recovery, pressure, pH, and pretreatment | High-frequency operating trend | Excluded transient period |
| Days 4–7 | Establish the stable-week median | Raw and normalized data set | Reference baseline |
| Week 2 | Compare stage behavior and feed variability | Stage ΔP, flow, conductivity, feed tests | Continue or investigate |
| Week 2–3 | Review chemical dose, residuals, filters, and biology | Dose/residual trend and maintenance events | Correct pretreatment if needed |
| Week 3–4 | Challenge the design against the observed worst condition | Projection update and limit review | Hold or reduce recovery |
| Day 30 | Approve alarms, investigation triggers, and clean protocol | Signed baseline card and response matrix | Controlled handover |
Five decision states
- Continue: normalized data and pretreatment controls operate within the specified limits of the approved baseline.
- Investigate: one signal drifts, but cause and persistence aren’t established.
- Correct pretreatment: upstream control or residual data explain the change.
- Reduce recovery: actual feed chemistry or tail-stage behavior is outside the projection.
- Plan cleaning: confirmed change crosses the installed supplier’s criterion and deposit evidence supports a compatible procedure.
Blue Membrane details its work across membrane elements and integrated ro systems; the company’s About Us page provides first-party context. For a project review, provide feed analysis, design recovery, element model, array, pretreatment steps, and at least one stable operating data set.
Discuss your feed analysis and operating baseline
Key takeaway: A commissioning baseline is a controlled reference for decisions and not a ceremonial start-up report.
Frequently Asked Questions
What tests are needed before designing a brackish water RO system?
Start with a complete, representative feedwater analysis and capture seasonal extremes where the source changes. The panel normally includes temperature, pH, alkalinity, hardness, major ions, silica, iron, manganese, turbidity, suspended matter or an appropriate fouling index, organics, and biological context. Record the analytical method and uncertainty. The final panel depends on the source, application, planned recovery, pretreatment method, and local water-quality requirements. Repeat critical tests when the source, season, pumping pattern, or upstream process changes.
Does a fouling-resistant RO membrane eliminate pretreatment?
No. A fouling-resistant element may reduce adhesion or improve cleanability for some organic or biological deposits, but it doesn’t remove hardness, silica, oxidants, suspended solids, or the effect of excessive recovery. It’s an element-selection decision made after feed analysis and pretreatment design. Cleaning, sanitation, and performance monitoring remain necessary throughout operation.
How can operators tell whether an RO system is fouling or scaling?
Use normalized flow, salt passage, and stage differential pressure as screening signals, then compare feed chemistry, recovery, pretreatment residuals, array position, biological indicators, and recent events. Mineral saturation modeling points toward scale; lead-stage deposits and biological evidence may point elsewhere. A deposit sample, membrane inspection, or autopsy may be required before selecting cleaning chemistry.
When should RO membranes be cleaned?
Use the installed membrane supplier’s current normalized cleaning criteria and the site’s validated early-warning controls. Investigate persistent change before it becomes severe. Don’t copy a percentage from another membrane manual, wait for raw pressure alone, or clean only because a calendar date arrived.
Can brackish water RO produce drinking water?
RO can reduce salts in brackish water, but potable use is a treatment-train and compliance outcome, not a membrane-only claim. The EPA treatment overview notes that RO may need pretreatment and post-treatment and produces a concentrate stream; feed contaminants, verified reduction performance, corrosion control, disinfection, storage, monitoring, certification scope, and local requirements still matter. The finished-water plan should define sampling points, laboratory methods, alarm response, operator responsibility, and actions for results outside the approved limit. It should identify contaminants that need controls outside the membrane stage, verify the final disinfection approach, account for distribution or storage changes, and define the records needed to release water for use. A qualified project team should validate the complete system for the intended application before commissioning and after any material change to the source or process.
References & Sources
- U.S. EPA: Overview of Drinking Water Treatment Technologies
- U.S. Bureau of Reclamation: Brackish Groundwater report
- Peer-reviewed review of reverse-osmosis membrane fouling
- 2026 industrial RO monitoring study using six years of operating data
- 2026 study on residual coagulant effects on RO fouling.
- Full-scale study of biofouling monitoring sensitivity
- Review of biofouling control and cleaning timing
- US11027240B2 antibiofilm spacer patent
- Water Online: emerging RO monitoring and fouling-control technologies
Engineering support
Need a membrane or RO system recommendation before your next quote?
Send feedwater data, capacity target, vessel size, operating pressure or replacement model details. Blue Membrane can help compare RO/NF grades, replacement options and system paths before you lock the specification.
RO / NF
Industrial membrane element selection
SWRO / BWRO
Desalination and brackish water systems
OEM match
Replacement and cross-reference support
RFQ checklist
What to include for faster model matching
- Water source and duty Well water, seawater, wastewater reuse, boiler feed, process water or potable water.
- Operating targets Feed TDS, flow rate, recovery, salt rejection target, temperature and pressure limits.
- Replacement context Current membrane model, element size, vessel count, fouling issue or cleaning history.
For urgent replacement checks, include photos of labels and vessel layout when available.