Get in touch with Blue Membrane Company

Quick Specs
| SDI15 gate before membrane | < 5 general / < 3 high-recovery designs |
| Free chlorine gate before membrane | < 0.1 ppm |
| Cartridge filtration rating | 1-10 micron (5 micron most common) |
| Typical operating pressure range | Up to 600 psi |
| Continuous pH tolerance | 3-10 (2-11 short-term) |
| Standalone equipment cost (typical) | $50,000-$500,000, chemistry-driven |
Here’s your industrial RO pretreatment guide because usually, your membrane problem isn’t actually a membrane problem – it’s a pretreatment problem that’s manifesting late. Source water is loaded with suspended solids, scale-causing ions, and leftover chlorine, none of which a raw reverse osmosis membrane can tolerate; each of the four stages in this pretreatment process (cartridge/media filtration, antiscalant dosing, chlorination/dechlorination, and SDI verification) is specifically designed to stop a certain failure mode from ever reaching the membrane’s surface. If you put your pretreatment stages in the correct order, membrane performance is predictable for years; if you don’t, fouling potential can build up undetected until a standard CIP doesn’t bring the flux back. Important: This article discusses pretreatment for feed water entering a ro membrane – NOT EPA National Pretreatment Program requirements for wastewater discharge, which can be found in the FAQ.
Industrial RO pretreatment is the physical and chemical sequence, usually cartridge/media filtration, antiscalant injection, chlorination and subsequent dechlorination, and SDI15 testing — applied to feed water prior to its arrival at a reverse osmosis membrane. Based on an analysis of more than 500 destroyed RO elements, nearly 60% of all fouling can be attributed to failures in the pretreatment train rather than in the membrane itself. Failure to include any single one of the four stages drastically reduces the element lifespan and nullifies almost all manufacturer warranties.
💡 Key takeaways
- Roughly 60% of RO fouling can be attributed to pretreatment gaps-a far more significant factor than the membrane-according to autopsy data on over 500 destroyed RO elements.
- There are two primary gates that feed water must pass before being introduced to the membrane: SDI15 must be less than 5 and free chlorine must be less than 0.1 ppm.
- It’s critical to remember that antiscalant dosing and softening address different issues; incorrectly choosing between them for your specific water chemistry will lead to sulfate scaling downstream.
- Purified water exiting the membrane is referred to as permeate, and the cleanliness of this permeate, as well as the membrane’s ability to produce it long-term, is determined by what the upstream pretreatment train removes.
- When a separate pretreatment train is used, $50,000-$500,000, becomes the primary cost driver rather than the membrane’s capacity.
What Is Industrial RO Pretreatment (and Why Skipping It Fails)?
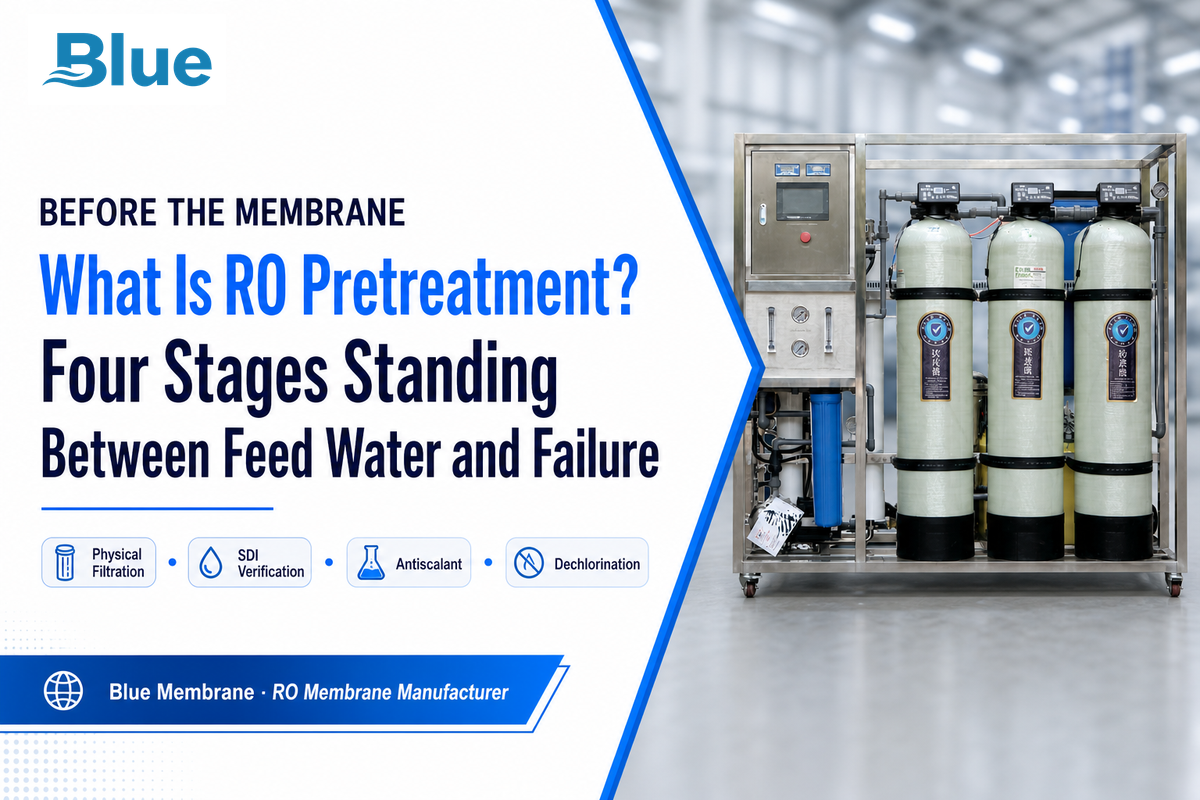
Industrial reverse osmosis pretreatment broadly refers to the series of physical and chemical treatments applied to feed water (feedwater) before it encounters a reverse osmosis membrane, and its existence stems from the fact that an unadulterated polyamide thin-film composite membrane can’t handle high levels of suspended solids, scale-causing ions, or leftover oxidizers. EPA confirms this general principle in its publication on drinking water treatment technologies, where it’s noted that pre-treatment is frequently a prerequisite for membrane separation to avoid fouling or plugging. What exactly comprises “pretreatment” will depend on the specific characteristics of your feed water, meaning the four-stage arrangement outlined below should be viewed as a decision matrix rather than a rigid blueprint. Across all industrial water treatment system applications, the core idea remains consistent: pretreatment methods are designed to adapt the equipment to the water chemistry, not the other way around.
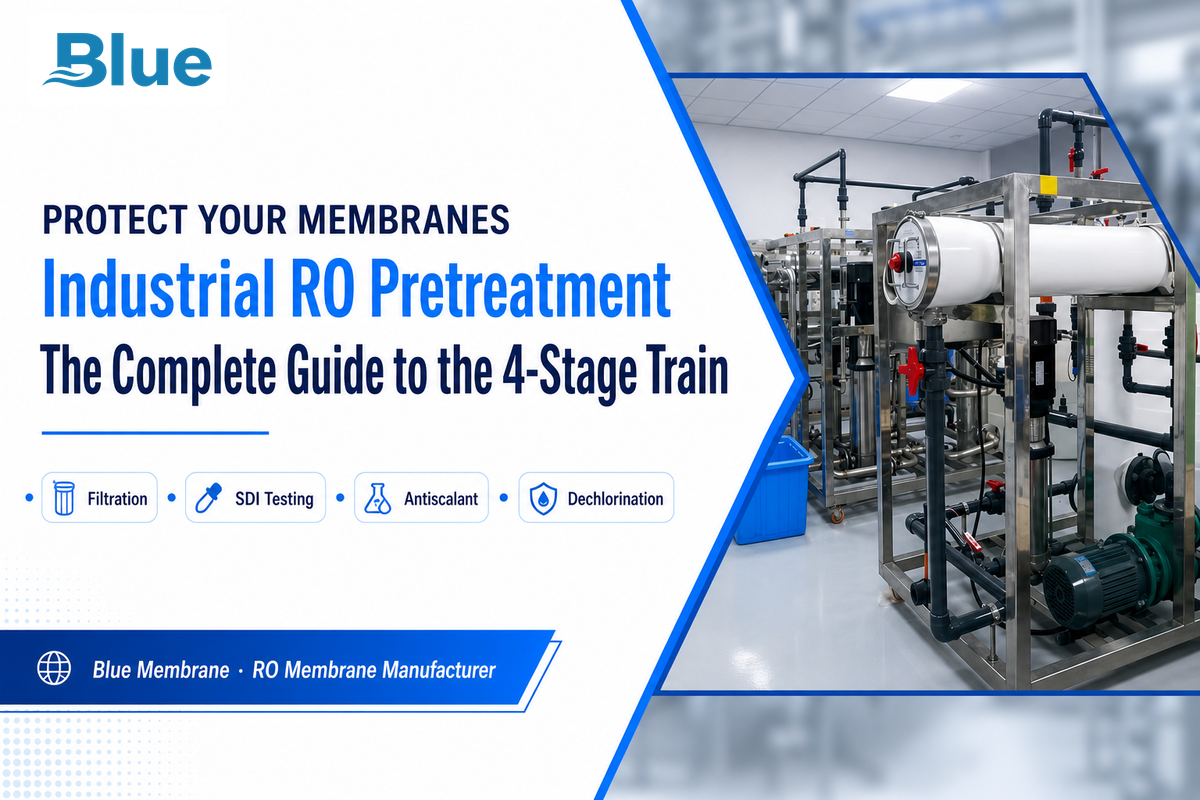
We call this the 4-Stage Pretreatment Train: (1) cartridge or media filtration to remove suspended solids, (2) antiscalant dosing to keep scale-forming ions in solution, (3) chlorination and subsequent dechlorination to kill biological growth without harming the membrane, and (4) SDI15 verification that the first three stages are functioning prior to feeding water into the membrane housing. Each stage is described in its own section below, but the order is important — dosing antiscalant after the filtration but before dechlorination, for instance, is a known failure pattern discussed in Chlorination and GAC Dechlorination. Treat this as the framework of your pretreatment system: the specific technologies within each stage are flexible, but failure to adhere to this sequence frequently ends in a failed system.
Key takeaway
The purified water that passes through the membrane is called permeate — the entire point of the 4-stage pretreatment train is protecting the membrane surface that produces it.
Choosing the right train is often dependent on knowing the characteristics of your feed water-including any trace iron and manganese which can foul elements independent of the scale-forming ions described below. Four representative feed water types and their associated pretreatment trains and target SDI15 are outlined in the table below; use this as a starting point for your system design, and verify your design with actual water analysis before finalizing any hardware specifications.
| Feed Water Source | Primary Risk | Recommended Pretreatment Train | Target SDI15 |
|---|---|---|---|
| Municipal / treated surface water | Residual chlorine, mild colloidal load | Cartridge filtration → dechlorination → antiscalant | < 5 |
| Untreated well water | Iron, silica, scaling ions | Multimedia filtration → antiscalant → cartridge polish | < 5 |
| Wastewater reuse | Organics, biological load, variable TDS | Multimedia + GAC → chlorination/dechlorination → antiscalant | < 4 |
| Seawater / high-TDS brine | Scaling (BaSO4/SrSO4/CaSO4), biofouling | Multimedia → antiscalant (adjusted dose) → cartridge → SDI verify | < 3 (high-recovery designs) |
Source: Blue Membrane technical guidelines and Z1/Z2 operating-limit data sheets.
Membrane Fouling Mechanisms: What 500+ Membrane Autopsies Reveal
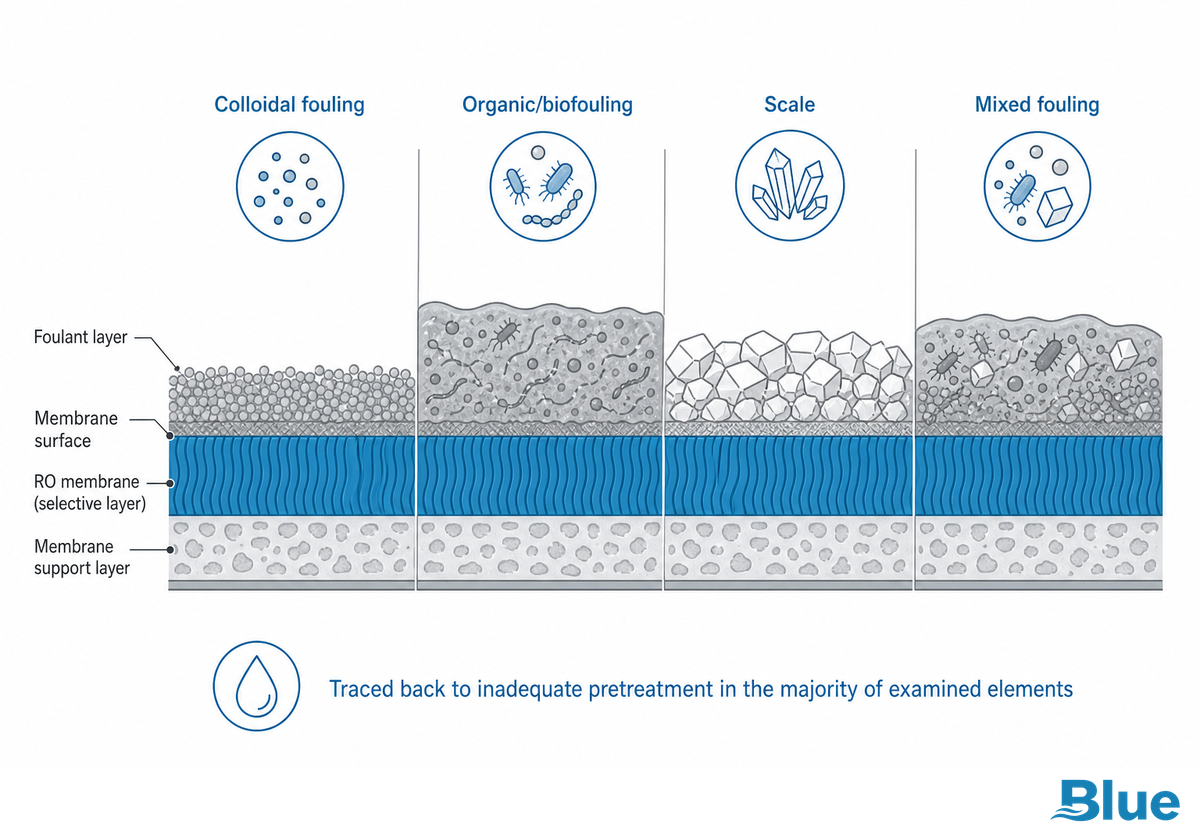
Membrane fouling can stem from several distinct causes, commonly grouped into four root-cause categories: biological/organic, colloidal, mineral scale, and mixed mode.
Data from Blue Membrane’s internal review of over 500 RO elements returned for autopsy indicate that more than 60% of fouled elements are the result of inadequate pretreatment, rather than a defect in the membrane itself. This is a proprietary dataset rather than a published, peer-reviewed statistic, so treat it as field data rather than an industry consensus figure. This dataset doesn’t include time frame, geographic installation, or classification methodology for the samples.
Independent research on the fouling process broadly confirms the extent of the problem, if not the precise statistics. A literature review on RO membrane fouling reinforces the notion that fouling is frequently a multifactorial process. Biological, colloidal, and scale fouling occur in tandem, which explains why Blue Membrane’s autopsy dataset includes a ‘mixed’ fouling category.
| Foulant Type | Share of Autopsied Elements | Pretreatment Stage That Prevents It |
|---|---|---|
| Biological / organic | 31% | Chlorination + dechlorination (see below) |
| Colloidal | 29% | Cartridge/media filtration + SDI verification (see below) |
| Mineral scale | 22% | Antiscalant dosing or softening (see below) |
| Mixed-mode | 35% | Full 4-stage train (overlapping causes) |
| — Biofilm & EPS (most common biological subtype) | subtype, not separately tracked | Chlorination + dechlorination (see below) |
| — Iron/aluminum oxides & clay fines (most common colloidal subtype) | subtype, not separately tracked | Cartridge/media filtration + SDI verification (see below) |
| — Calcium carbonate & calcium sulfate (most common scale subtype) | subtype, not separately tracked | Antiscalant dosing or softening (see below) |
| — Biological + scale co-fouling (most frequent mixed pattern) | subtype, not separately tracked | Full 4-stage train (overlapping causes) |
Source: Blue Membrane internal review of over 500 RO elements (proprietary field dataset). Categories overlap as the mixed-mode case represents systems with multiple fouling mechanisms.
These sub-type rows represent the common foulant species observed for each category per typical RO fouling literature; they aren’t independently measured in the autopsy dataset.
💡 Pro Tip 6-in-10 Fouling-Traceback Rule
Do not assume a membrane batch is defective without reviewing the pretreatment log first; Blue Membrane’s autopsy dataset revealed that 6 out of 10 fouled elements had an upstream pretreatment deficit, not a membrane malfunction.
What Are the Methods of Pretreatment of Water?
Water pretreatment for reverse osmosis employs four coordinated methods: cartridge or media filtration to remove suspended solids to a target micron rating; antiscalant dosing to prevent the precipitation of dissolved calcium, barium, strontium and silica compounds on the membrane surface; chlorination followed by dechlorination to control microbial growth without exposure of the membrane to free chlorine; and SDI15 to verify the water is suitable for the membrane. Usually these are implemented in this order; setups vary by water source, refer to the decision table above.
The Physical Filtration Stage: Cartridge and Media Filtration
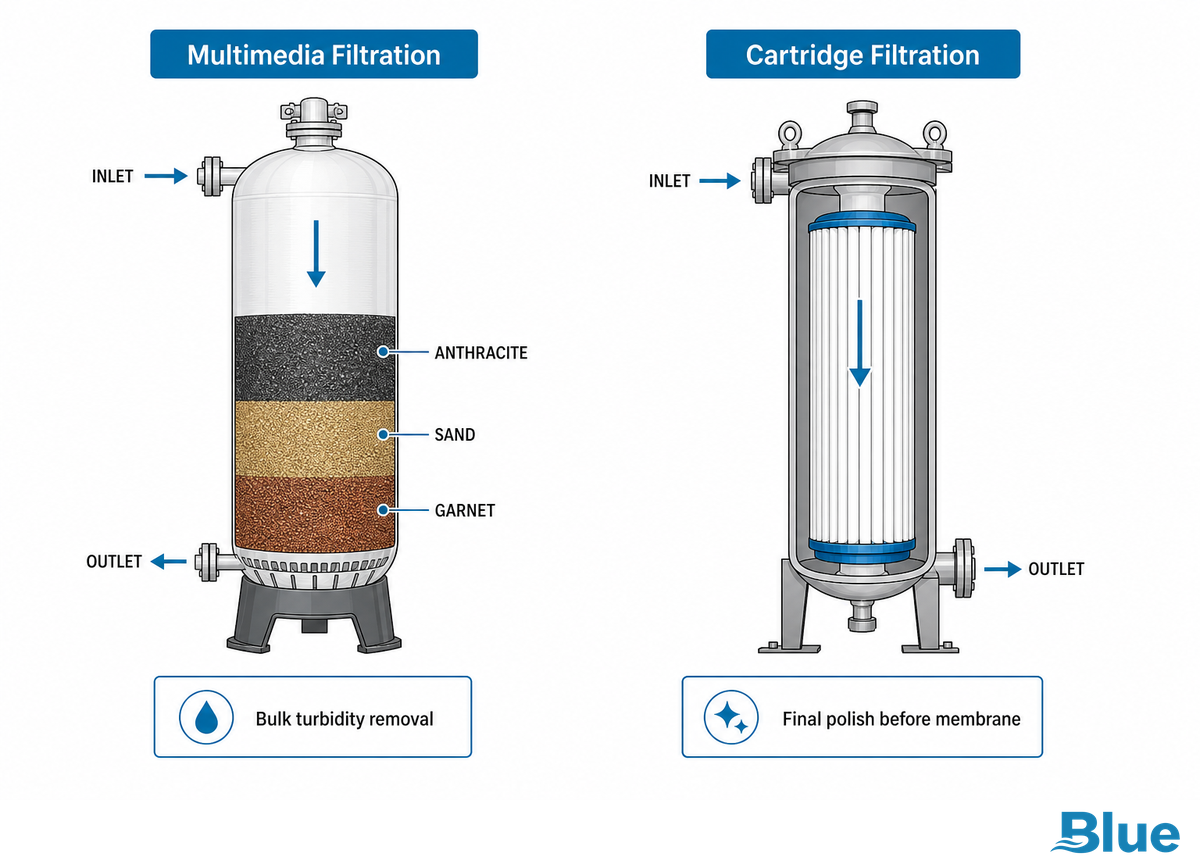
Cartridge and media filtration provides the first physical filter of suspended solids. Multimedia filters remove particles down to ~10-20 microns and are typically sized to accommodate constant high-turbidity feed; cartridge filters (1, 5, or 10 microns) serve as a polisher just upstream of the membrane. Membrane Chemicals’ product literature routinely specifies 1, 5 and 10 micron cartridge filters, with 5-micron pre-filters most commonly placed just before the membrane, changed based on differential pressure, not on a calendar.
Multimedia filters can eliminate particulate matter – a mix of silt, sand, and precipitated solids and debris that could otherwise cause excess differential pressure across the first membrane element. Design guidance from multimedia filtration specifications indicates they typically address turbidity of 0.2 NTU or SDI greater than 3. Multimedia filters usually require backwashing when the differential pressure reaches 10 to 15 psi.
For high colloidal or biological loads beyond the capability of the cartridge filtration stage alone, ultrafiltration (UF) or microfiltration (MF) can be inserted upstream of the membrane housing, producing finer filtration than multimedia filtration and lower and more consistent SDI15 than a simple filtration stage at additional cost in space and investment. UF is usually specified over MF for industrial RO systems due to the more challenging colloidal fouling risks typically handled by its finer pores, but either still require antiscalant dosing and dechlorination — they tackle the physical, not the chemical problems, and should be considered whenever a highly variable or unpredictable colloidal load is present.
| Attribute | Multimedia Filtration | Cartridge Filtration |
|---|---|---|
| Typical micron range | 10-20 micron (backwashable bed) | 1-10 micron, most commonly 5 micron |
| Best-fit use case | SDI > 3 or turbidity > 0.2 NTU, continuous higher-turbidity feed | Final polishing stage immediately before membrane housing |
| Maintenance trigger | 10-15 psi differential → automatic backwash | 15-25 psi differential → element replacement |
Sources: Membrane Chemicals cartridge filtration specifications; Pure Aqua multimedia filtration design data.
SDI Testing: Verifying Feed Water Is Ready for the Membrane
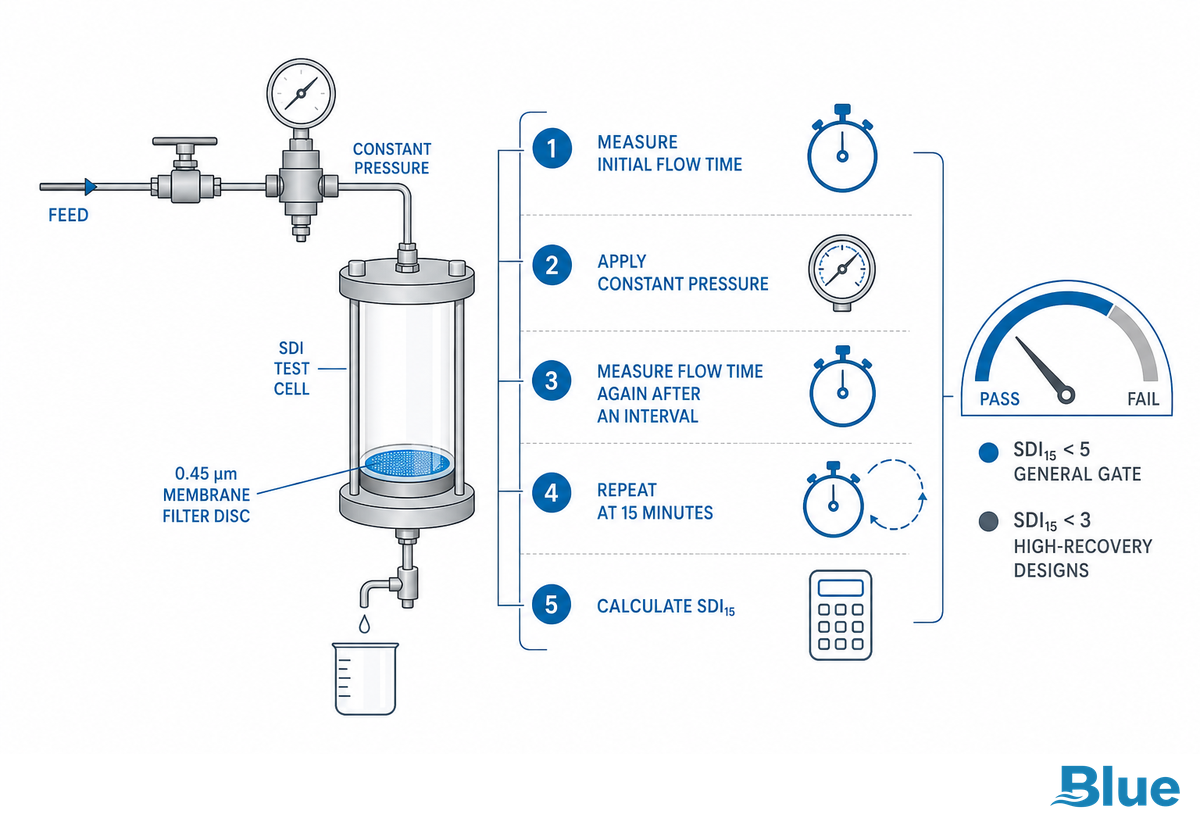
SDI15 testing ensures the integrity of the upstream filtration process prior to the feed water arriving at the membrane housing. An SDI15 of below 5 is typically accepted as a passing criteria, though systems with higher membrane recovery often specify SDI15 values below 3. This value is the internal standard used at Blue Membrane for all Z1 and Z2 systems, and it aligns with the standard silt density index used throughout the RO/NF industry, albeit often adjusted for design-specific operating points.
SDI15 testing has a well-documented limitation worth knowing before you rely on it as the sole gate: field best-practice guidance notes that SDI is widely used to predict colloidal fouling tendency but can’t fully simulate the cross-flow hydraulics within a spiral-wound element, so a passing SDI result is necessary but not sufficient, pair it with periodic differential-pressure trending once the system is running (see Maintenance, Troubleshooting, and Long-Term Pretreatment Performance).
That delta is greater than a hydraulics issue, and it warrants explicit mention, if only because it contradicts how most pretreatment guides treat numeric gates like these. A peer-reviewed comparison of RO fouling-prediction indicators found that MFI0.45 and the SDI-family metrics are “not sensitive enough” to accurately assess biological fouling risk individually, with conventional pretreatment removing roughly 24-41 percent of biological foulant potential in the water tested, compared to more than 80 percent removal for particulate fouling potential over the same run. This means that a system can satisfy all the criteria outlined here, and still be host to a latent, accumulating biologic fouling risk that neither number was intended to capture. This makes a strong case for differential pressure trends (mentioned previously), and the CIP triggers from Maintenance, Troubleshooting, and Long-Term Pretreatment Performance stronger than a simple “better safe than sorry” guideline, as meeting the numeric targets proves the water’s cleanliness for that instant, not that the biologic fouling is done.
- 1. Filter a fixed volume of sample through a 0.45 micron membrane filter at constant pressure (normally 30 psi).
- 2. Record the start time to process the first sample volume.
- 3. Stop filtering at the 15 minute mark, then record the final time to filter the same volume.
- 4. SDI15 is computed by taking the ratio of the initial and final times.
- 5. Check against: < 5 in a general case, < 3 in high recovery ones.
⚠️ Important, The Chlorine-SDI Double Gate (part 1 of 2)
SDI15 < 5 isn’t quite all of the readiness check though, feed water needs to get free of the chlorine gate as well and these two numbers together is the true passing / fail bar you must get before interacting with the membrane.
Antiscalant Dosing: Preventing Scale Without Overdosing
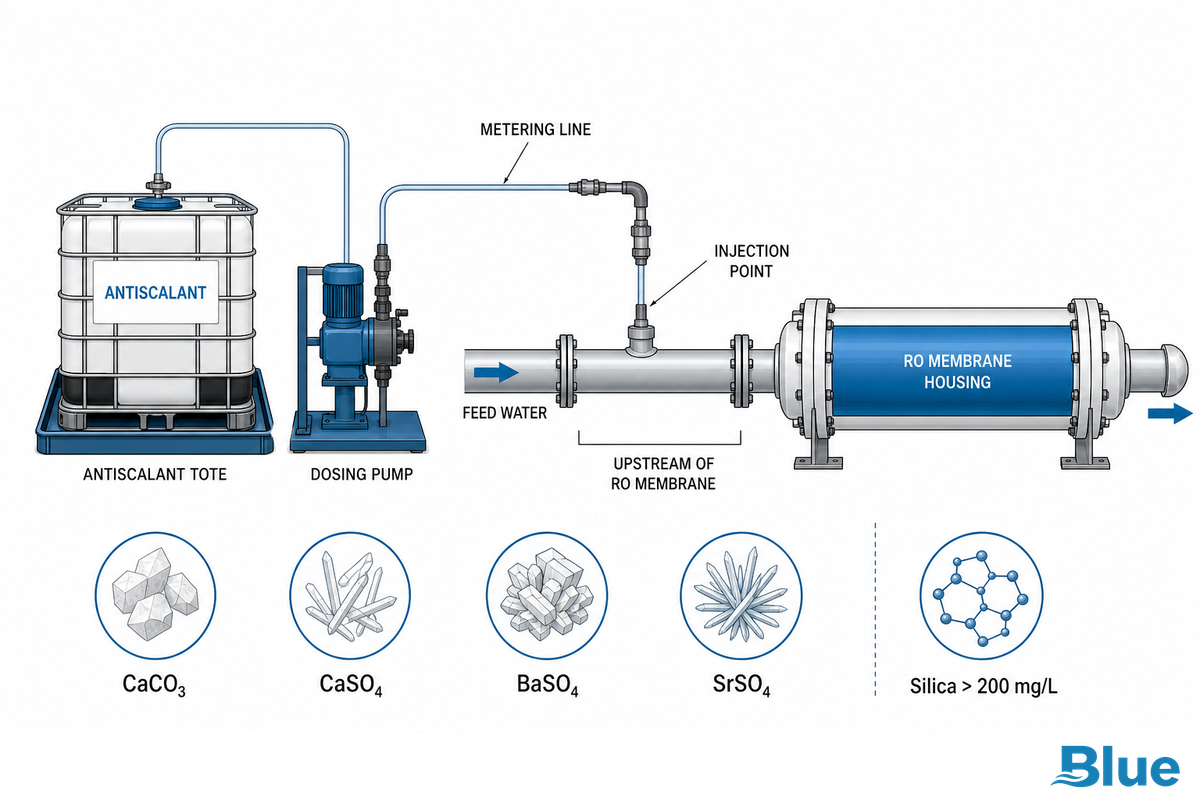
Antiscalant dosing is designed to prevent the precipitated scale-forming ions such as calcium carbonate, calcium sulfate, barium sulfate, strontium sulfate, and silica, which form within the pipeline system and the water itself, from precipitating out onto the surface of the membrane system by keeping them in solution long enough to flow through it. Blue Membrane’s own Z1 design guidelines suggest an initial chemical dosing range between 1 to 5mg/L that should be scaled according to the scaling index on the feed water system; again this is manufacturer’s design guidance and not an independently tested and verified number across all 5 scale types, so please refer to your feed-water analysis for guidance.
For silica, more direct and independently verifiable evidence comes from patent literature; an antiscalant formulation patent shows ranges roughly 1-100 ppm of the patented formulation, narrowing to 3-30 ppm in the patent’s preferred embodiment formulation specific to silicate-scaling conditions. Note again that this is the range from the patent on a specific formulation, not a validated general industry standard, but it confirms a much broader practical window than a single flat value and specifically applies to high-silica feed water rather than the overall CaCO3/CaSO4/BaSO4/SrSO4 scaling mixture. View the 1-5 mg/L range below as your practical starting point, and the patent range as a confirmation that silica-heavy feed water likely requires adjustment outside that window.
| Scale Species | Typical Trigger Condition | Dosing Note |
|---|---|---|
| Calcium carbonate (CaCO3) | High hardness, elevated pH concentrate | Start at manufacturer’s recommended range; retitrate against LSI |
| Calcium / barium / strontium sulfate | High sulfate load in concentrate stream | Sulfate-specific antiscalant chemistry generally required |
| Silica | Feed silica > 200 mg/L | 1-100 ppm broad range / 3-30 ppm typical (silicate-specific formulation) |
Sources: Blue Membrane Z1 design guidance (internal); antiscalant formulation patent US20220331742A1 (external verification of silica-relevant aspects).
How to Predict Scaling and Corrosion in Circulating Water Systems?
At the heart of scaling and corrosion prediction in any circulating water system is a calculation of a saturation index, most commonly the Langelier Saturation Index (LSI), that determines how water chemistry deviates from saturation at the given water temperature and pH. A positive LSI suggests scaling; a negative LSI suggests corrosion. This applies equally to the RO concentrate stream, where rejected ions are, by design, 2-5 times (and sometimes more) concentrated over the feed – which is why antiscalant dosing is calculated against concentrate-side LSI, not raw feed water, and why the 1-5 mg/L baseline range below must be retitrated when recovery rate chemistry varies. In terms of practical design, a general convention is 75% recovery as a standard design limit that’s conservative; any RO design exceeding 90% recovery must implement tighter water-chemistry control, including more accurate antiscalant dosing.
Water Softening vs. Antiscalant Injection: Choosing Your Scale-Control Method
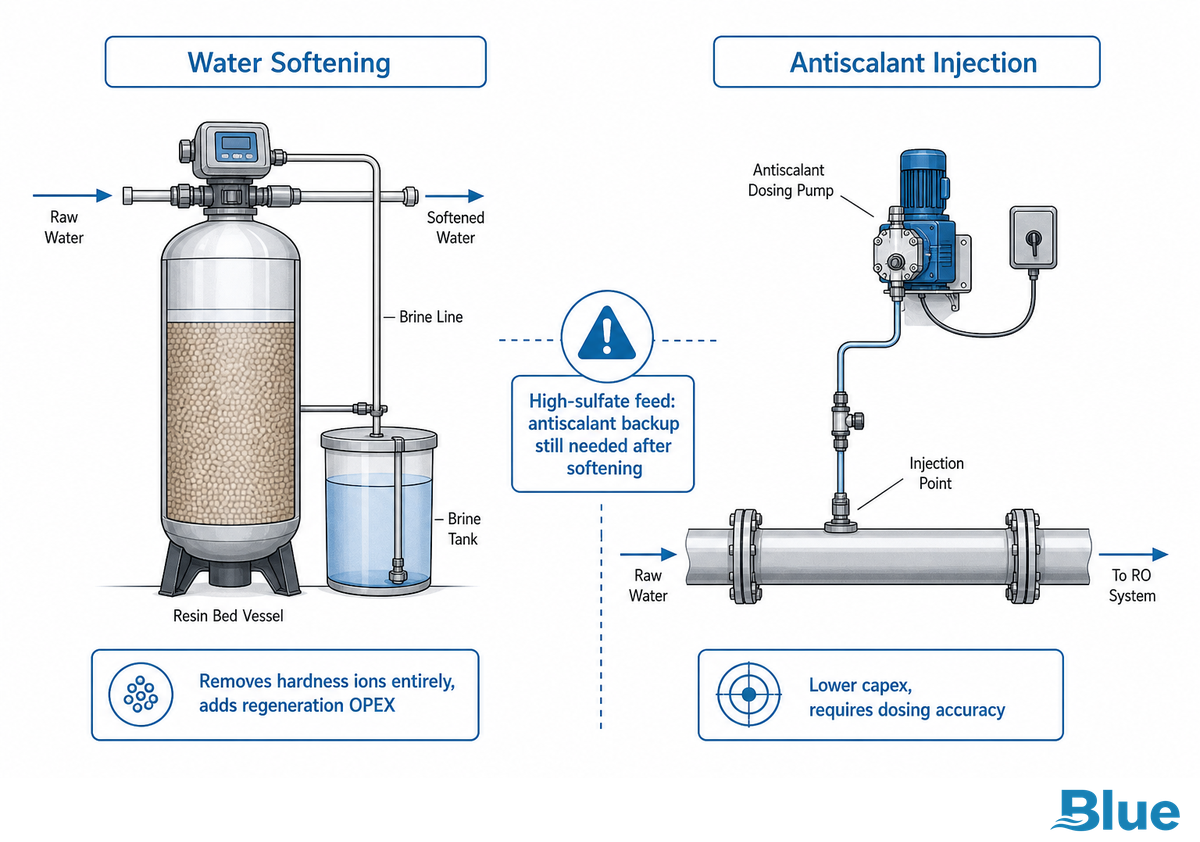
Both the water softening approach and the antiscalant injection approach fix the same scaling problem in different ways — softening completely removes hardness ions from the feed through ion exchange, while antiscalant leaves them dissolved and non-reactive — and which is better really comes down to feed hardness, sulfate load, and your willingness to bear more capital costs upfront versus operating costs over time. In general, higher calcium/sulfate-dominant feed water causes scaling faster and more severely than similar hardness sodium/chloride-dominant feed water, so you may find sites with similar lab hardness levels require markedly different treatment approaches. Cost information from independent water-treatment engineers in fact converges from two directions on the same answer: the capital cost for softening is substantially higher than that for antiscalant addition across a broad range of hardness levels. A comparison of present-worth costs conducted by Lenntech determined that softening was never a cost-competitive alternative to antiscalant addition on a lifecycle-cost basis for any of the hardness levels studied, and a closely related finding came from another, unrelated vendor. Fundamentally, both methods serve the same goal of stabilizing water chemistry before it reaches the membrane — they’re ways of dealing with scale-forming ions, either removing them from solution or preventing them from scaling out. What matters most is picking the approach that fits your feed chemistry and operating budget, since either one, correctly sized, protects the membrane and supports high-purity permeate output.
Water Softening
- Removes hardness ions entirely via ion exchange
- Higher capital cost (roughly 10x antiscalant equipment cost per independent vendor cost tables)
- Ongoing salt/regeneration OPEX
- Best fit: very high hardness with limited operator attention for dosing accuracy
Antiscalant Injection
- Keeps scale-forming ions dissolved, doesn’t remove them
- Lower capital cost, ongoing chemical + dosing-accuracy requirement
- Requires monitoring to avoid underdosing or overdosing
- Best fit: moderate hardness, cost-sensitive CAPEX, and consistent feed chemistry
SOURCES: Water antiscalants technical resource (Lenntech), Nordic filtration antiscalant-vs-softening comparison (an independent cross-validation of capital-cost gap).
⚠️ Common Mistake
Use of softening alone in high-sulfate feed water waters has been documented as a common cause of failure. Softening removes calcium and magnesium ions, but does nothing for sulfate. A facility that only softens may experience barium or strontium sulfate scaling in downstream components, particularly where the concentration of those ions becomes very high, such as in a high-recovery design where the concentration of all ions in the concentrate is multiplied by the recovery ratio.
Chlorination and GAC Dechlorination: Protecting the Membrane from Biological Growth
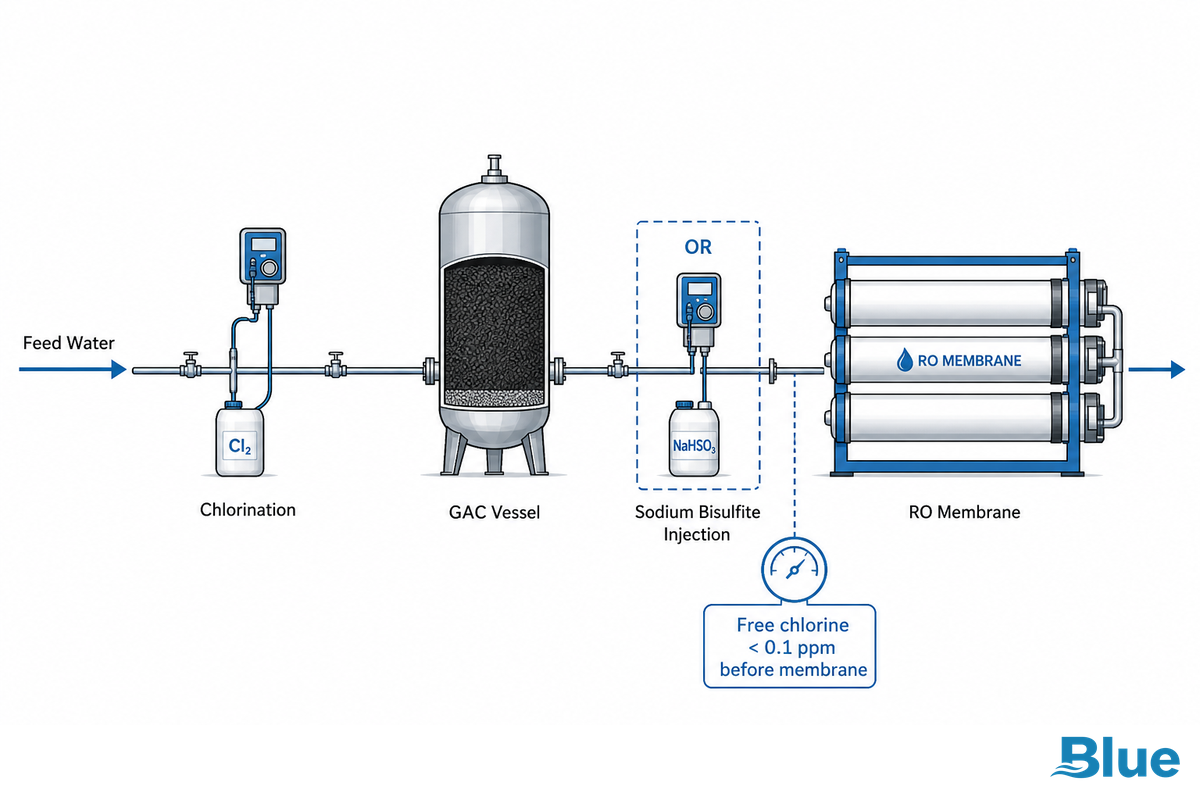
Chlorination may be used to control bio-growth in the pretreatment train, but the free chlorine responsible for killing bacteria will destroy the thin-film composite membrane on contact. Thus, all chlorinated streams must include a step for removing the free chlorine, typically by passing them through GAC (granular activated carbon) or through sodium bisulfite injection, immediately upstream of the membrane, to protect RO membranes from oxidative attack. Free chlorine causes progressive, generally irreversible oxidative damage to polyamide membranes. A chlorine-exposure tolerance guideline commonly referenced in membrane manufacturer technical literature, often summarized informally as “1 ppm for 1,000 hours” — may be misread as license for occasional, intermittent chlorine exposure; the exact phrasing and its prevalence aren’t independently verified against a publicly accessible source here, so treat it as an industry rule of thumb rather than a cited standard. Such a reading runs counter to how membrane engineers generally describe the mechanisms of cumulative oxidative damage. Industry field reporting on common RO design and operation mistakes invariably identifies SDI removal, coupled with a downstream dechlorination step, as one of the more preventable, yet frequent, causes of system failure.
Keeping specified free chlorine below 0.1 ppm before feed water reaches the membrane is a Blue Membrane proprietary Z1/Z2 operating-limit datasheet figure, not an externally-published Tier-1 standard number. (The various other manufacturers all publish something similar, but not always the same, so always double check the specific value in your specific membrane datasheet.)
“The chlorinate-then-dechlorinate sequence looks redundant to operators who haven’t dealt with a biofouled train, but it isn’t, you need the chlorine to control biological growth upstream, and you need it gone completely before the membrane. Systems that try to skip one side of that sequence to save on GAC media almost always pay for it in early membrane replacement instead.”
Blue Membrane technical team
⚠️ The Chlorine-SDI Double Gate (part 2 of 2)
Free chlorine below 0.1 ppm and SDI15 below 5 are the two real numeric gates a pretreatment train has to clear before feed water is ready for the membrane.
Pass one without the other and you’ve only solved half the fouling problem.
Desalination and High-TDS Brine Pretreatment: What Changes
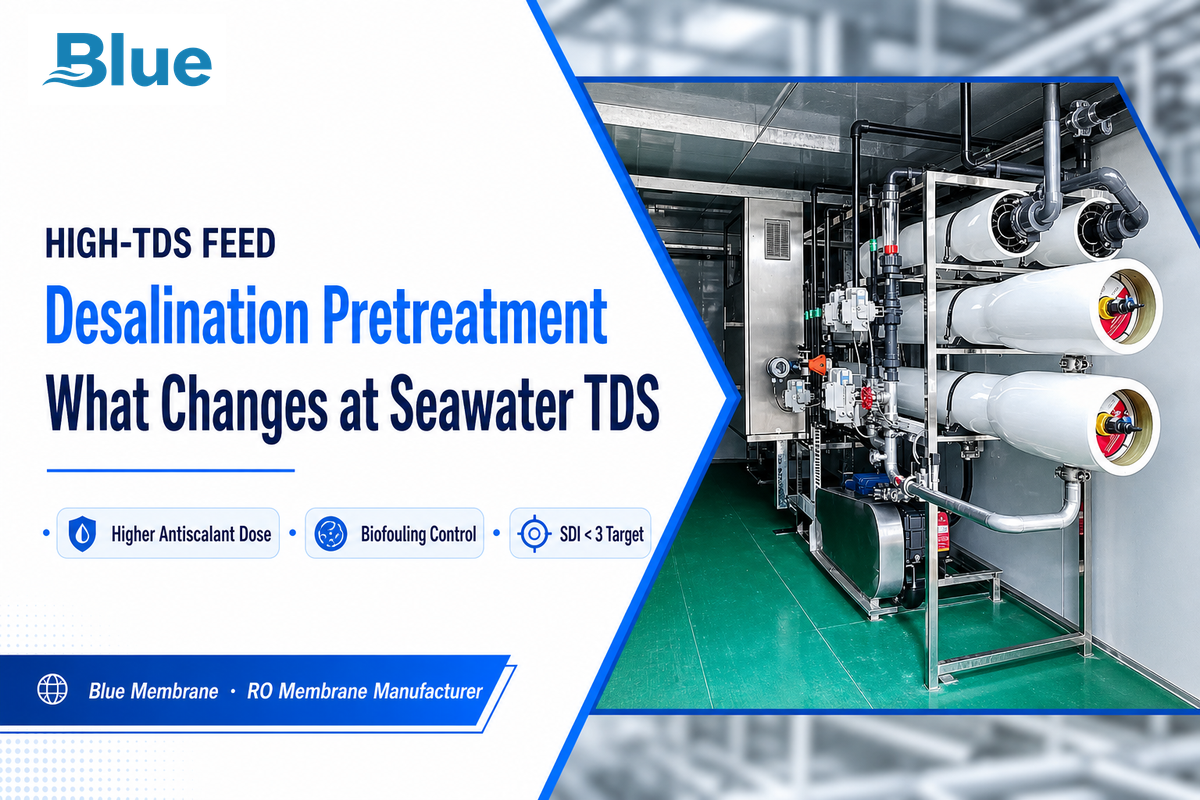
High-TDS and seawater feed change the pretreatment plan in three specific ways.
Antiscalant dosing needs to be re-titrated for the higher ionic strength. SDI15 targets are typically tightened in high-recovery designs. And the membrane series itself needs to be rated for the elevated feed TDS.
Z2 series specifications reflect a Blue Membrane proprietary design limit (feed TDS 10,000 ppm max), not a universal industry ceiling, so be sure to confirm the appropriate rating for other manufacturer series for brine or seawater applications. This re-titration applies equally to reclaimed water and industrial wastewater reuse applications where TDS and organic load can swing seasonally without the consistent high salinity of seawater. A recent peer-reviewed review of reverse osmosis desalination confirms this same pattern at the literature level: as feed salinity rises, scaling risk and pretreatment demands (antiscalant chemistry, membrane selection) increase non-linearly rather than scaling in simple proportion to TDS, which is why a re-titration — not just a dosage bump — is the right framing.
⚠️ Common Mistake
Carrying over a standard-TDS antiscalant dosing rate to a high-TDS or brine feed without re-titrating for ionic strength is a well-documented failure pattern. Higher ionic strength changes the solubilities of scale species, and a dosing rate that was calibrated for municipal or well-water feeds will be insufficient for brine-feed applications.
Integration & Utility Requirements: Power, Footprint, and Materials Compatibility
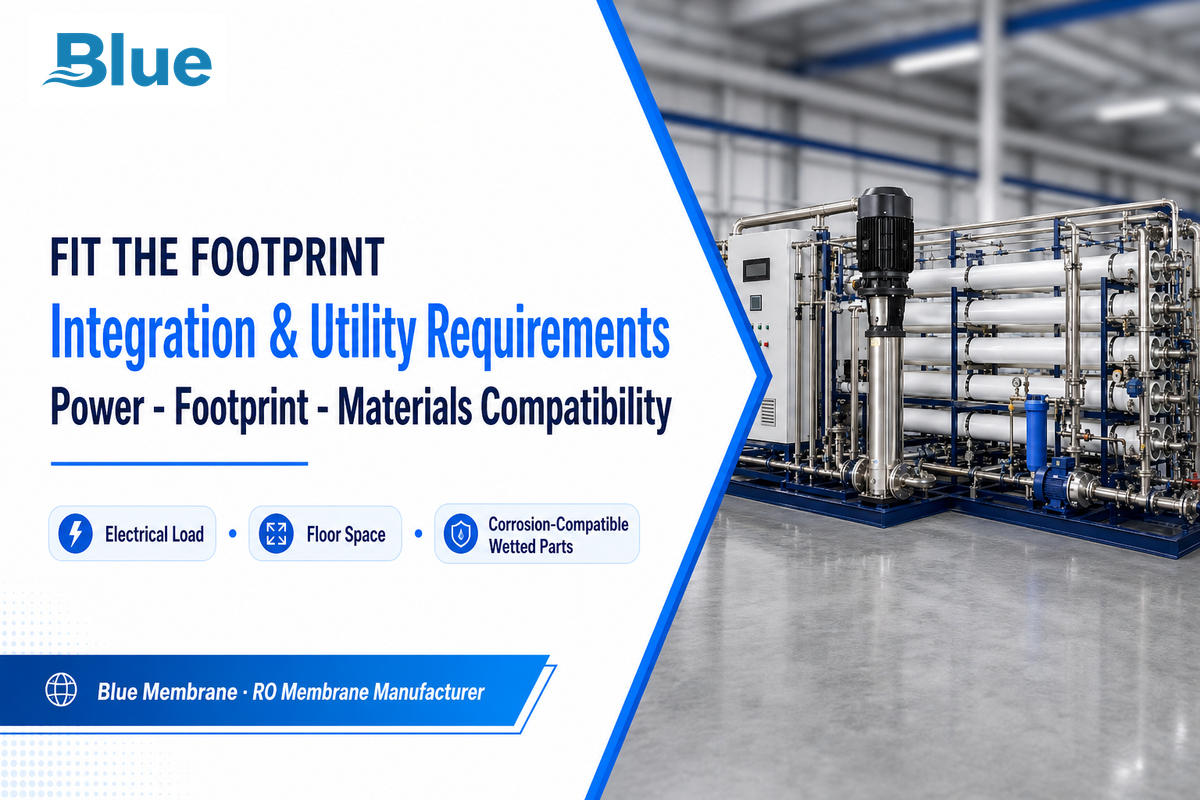
Before a pretreatment system can be integrated into an existing plant, four technical questions need to be answered: (1) what’s the electrical load profile of the new unit (are the dosing pumps and backwash cycles run by VFDs or fixed-speed motors?); (2) what’s the footprint of the skid, including service clearances; (3) what are the periodic backwash and CIP water and energy consumption; and (4) how will the system’s outlet TDS interact with the downstream process?
These four items — power, footprint, water and energy, and outlet water quality — are the universal, cross-vendor technical checklists a plant engineer must ask for when issuing an RFQ for any new, process-connected equipment. These are also the four critical areas that differentiate a water treatment that operates as designed for 10 years from one that requires expensive early rework to maintain the reverse osmosis output within spec. The entire checklist is designed to insulate the RO membranes from surprise, utility-side integration issues — not just from water chemistry issues.
There’s some published literature modeling the variable-frequency-drive (VFD) strategies of the RO pump for energy optimization, but the most detailed modeling of VFD for industrial process RO appears in a non-peer-reviewed preprint about seawater desalination (SWRO). A related peer-reviewed study of variable-speed operation for RO systems (Desalination, Elsevier) models a comparable VFD-driven optimization strategy for the high-pressure pump. SWRO energy and wash-water dynamics are different from industrial processes, so be wary of specific percentages for energy savings found in the SWRO literature and use them for directional reference only for your installation.
| Parameter | Limit |
|---|---|
| Max operating pressure | 600 psi |
| Max operating temperature | 45°C |
| pH tolerance | 3-10 continuous / 2-11 short-term (CIP) |
Source: Blue Membrane Z1/Z2 operating-limit datasheets.
Procurement Checklist: Evaluating Pretreatment Vendors and Systems
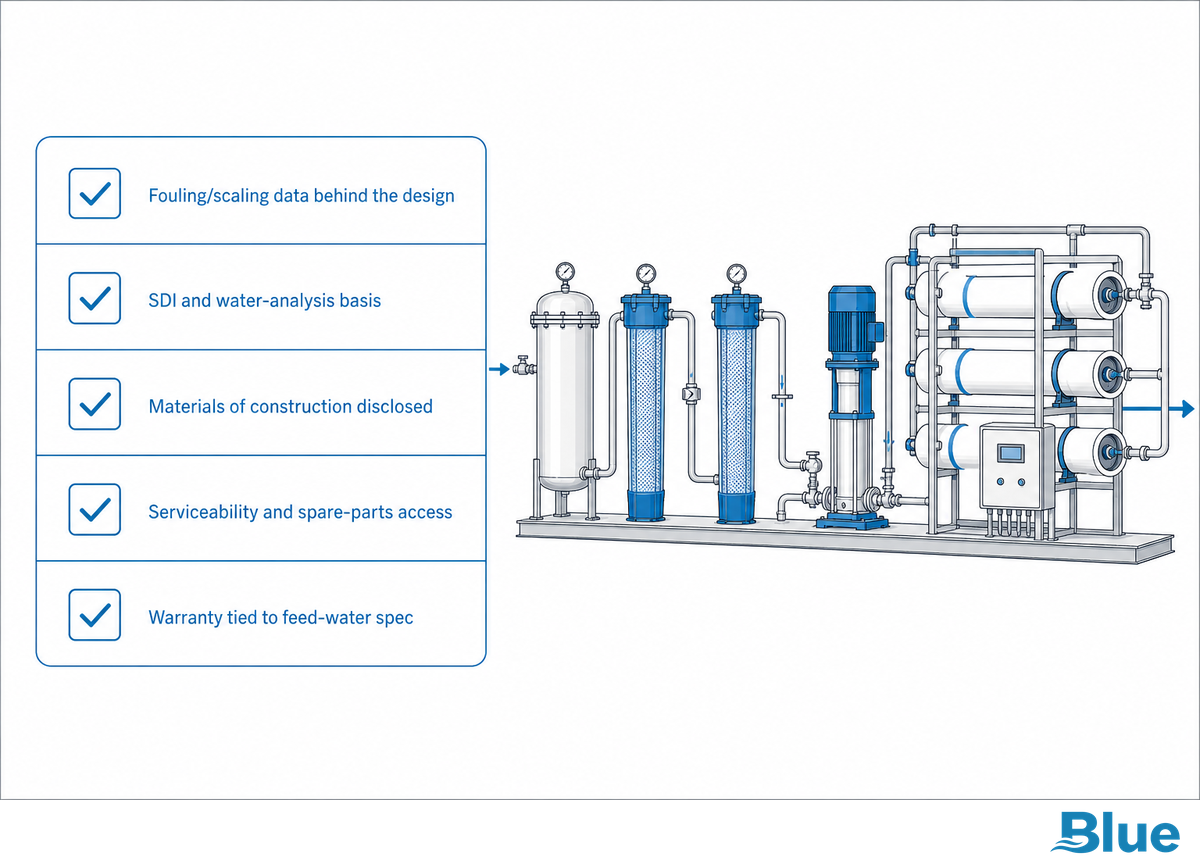
Evaluating an industrial RO system vendor becomes a matter of lining their specification sheet with your actual water analysis, rather than their generic claim of capabilities. Pretreatment equipment is typically priced as part of the full industrial RO system rather than as a separately quoted line item, and complete industrial RO systems commonly cost $50,000-$500,000+ depending on feed water chemistry and system capacity. Third-party industrial RO system cost estimates put the RO skid itself at $15,000-$50,000 for up to 10,000 gallons per day (GPD), medium systems at 50,000 to 100,000 GPD between $100,000-$300,000, and large-scale systems over $1 million for 500,000+ GPD — and per that source, those tiers usually cover the skid itself, not the storage tanks, pretreatment media, post-treatment, or installation labor a complete project also needs, so budget above the bare-skid tier for a full build. In addition to those high-level costs, remember that the water chemistry is what determines where in this spectrum your project will land — and not the number of membranes. Therefore, have a water analysis conducted before soliciting bids from RO vendors, not after. A high-performing RO system isn’t one purchased based on the brand names on the RO vendor’s equipment, but one carefully matched to your feed — a mid-tier reverse osmosis system matched to the feed will outperform a high-end model matched improperly.
There are a couple of standard, named-reference points that you can put to an RO vendor directly. The first is ASTM D4516 which standardizes reverse osmosis data so that any spec sheet must be able to cross-reference to this standard. If the vendor cannot, this should be a warning flag. Second, if the vendor mentions NSF/ANSI 58 certification, it’s wise to ask exactly what this covers before assuming that it means anything in the context of an industrial process; the NSF/ANSI 58 standard primarily applies to point-of-use or point-of-entry water purification equipment, so industrial RO skids must be specifically assessed against their supplier for the applicability of any certification, as it is not automatic.
RFQ checklist — copy these into your quote request:
| Parameter | Recommended Range | Why It Matters | How to Verify |
|---|---|---|---|
| Feed water SDI15 | < 5 (< 3 high-recovery) | Confirms filtration stage is correctly sized | Request SDI test method + on-site verification plan |
| Free chlorine at membrane inlet | < 0.1 ppm | Prevents oxidative membrane damage | Request dechlorination stage sizing calc |
| Antiscalant dosing accuracy | ±5% of setpoint | Under/overdosing both cause failures | Ask for dosing pump calibration certificate |
| ASTM D4516 cross-reference | Provided on spec sheet | Standardizes performance-data comparison across vendors | Request the normalized performance data directly |
| Max feed TDS rating | Confirm vs. your feed water | Undersized TDS rating shortens membrane life | Request membrane series datasheet |
| Applicable certification (if claimed) | Confirm scope, not just presence | POU/POE certifications (e.g., NSF/ANSI 58) don’t automatically cover industrial-scale skids | Ask supplier which standard version/scope applies |
Installation and Commissioning: Getting Pretreatment Right the First Time
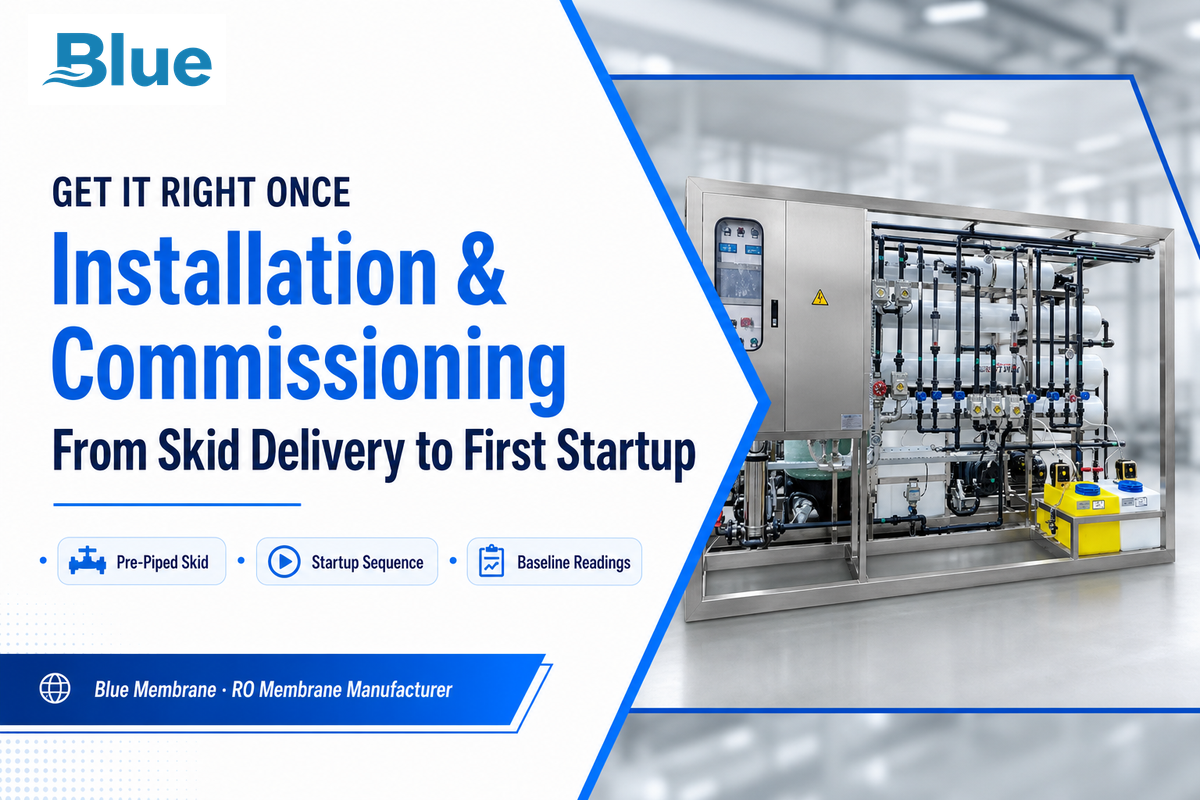
The standard operating sequence for safely commissioning a new pretreatment train includes confirming mechanical installation, ensuring instruments are calibrated, performing a standalone filtration and dosing phase to verify initial water quality, and confirming both SDI15 and free chlorine have cleared their gates before starting up the membrane. Equipment manufacturers provide these procedures in their manuals – this is confirmation that structured startup guidance exists throughout the industry, but details vary between vendors and you must confirm the steps and acceptance criteria are in accordance with your specific system’s operating records rather than assuming generic guidance is appropriate. The SDI15 acceptance gate itself is tested according to the standardized method defined in ASTM D4189-23, so commissioning teams should confirm their field test procedure and equipment match that standard’s protocol, not just the manufacturer’s pass/fail number. Getting commissioning correct first sets the benchmark for long-term performance of the RO; the initial differential-pressure and normalized flux numbers are the basis against which future CIP cleanings will be compared.
- Before introducing water, verify mechanical installation, piping, and instrument calibration.
- Run the filtration and antiscalant dosing phases on their own, sampling and testing for feed water immediately upstream of the membrane housing.
- Make sure SDI15 < 5 (or < 3 for high-recovery designs) and free chlorine < 0.1 ppm before moving on to the next step.
- Slowly increase the membrane flow rate to manufacturer-recommended start-up levels as per their recommended schedule.
- Document the baseline differential pressure and normalized permeate flux to use as reference values for all subsequent fouling trend analyses (see Maintenance, Troubleshooting, and Long-Term Pretreatment Performance).
⚠️ Common Mistake
It is a documented, yet preventable, cause of early RO system failure to start up the pretreatment train prior to ensuring a healthy water quality baseline is confirmed. Failure to confirm the status of SDI15 and free chlorine as separate, standalone values prior to introducing water to the membrane is one of the leading contributors to early-life fouling and is reflected in the “autopsy” data as damage that occurred within the first few weeks of operation.
Maintenance, Troubleshooting, and Long-Term Pretreatment Performance
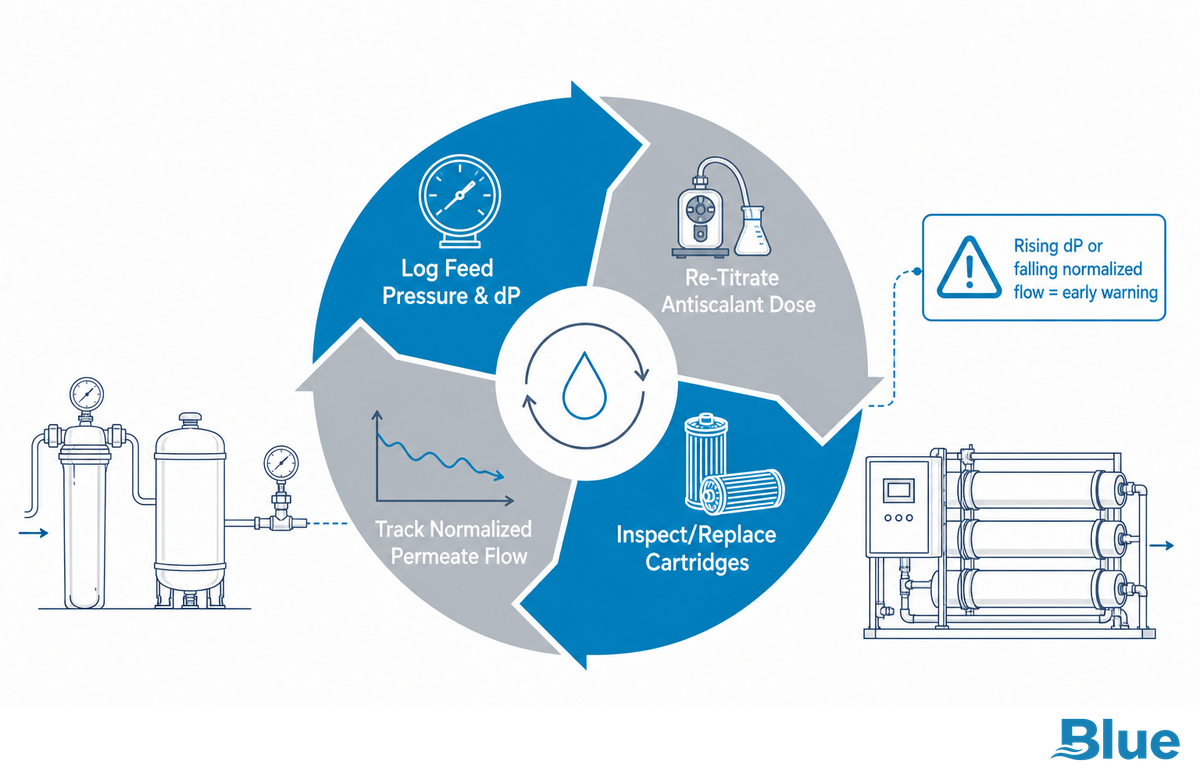
Pretreatment failure initially manifests as increasing differential pressure, falling normalized permeate flow, and declining overall system performance — catching the trend early is often the difference between a simple CIP to recover long-term RO performance and the need for membrane replacement. In a peer-reviewed, open-access study of full-scale RO and nanofiltration installations, researchers determined fouling accounts for about 24% of total operating expenditure at surface-water RO plants in the Netherlands, a genuinely externally-verified figure, not a manufacturer estimate, though it reflects Dutch surface-water RO installations specifically and should be treated as an order-of-magnitude reference rather than a number that transfers precisely to every industrial process RO application.
Let’s look at a real-world case study in terms of what that OPEX exposure looks like: a facility processing canned foods used a 4-stage pretreatment system with sodium hexametaphosphate as the antiscalant to treat its process water, and managed a recovery rate of 65-70% with a running cost of approximately $2.62 per cubic meter. The case study is one of Blue Membrane’s own projects rather than an independent, third-party-verified report, so the dollar figure is used as an indication of a similar cost under comparable feed conditions and shouldn’t be assumed as fact for a different operation.
~24%of OPEX from fouling, surface-water RO (Netherlands study)
65-70%recovery, canned-food effluent case study
$2.62/m³operating cost, same case study
On constant-flow operation: forum-based field engineers often describe constant flow as an absolute rule, with no variation allowed at all. This is a slight exaggeration. Flow variation isn’t inherently dangerous; however, it’s only acceptable under specific, tight, controlled conditions — a relatively limited operating window in terms of differential pressure, plus a defined, regular flush protocol coupled with online monitoring that would catch any drift immediately. Where that online water-quality instrumentation isn’t installed, the field engineers’ caution about constant flow is typically warranted, and the real key to longevity remains the discipline highlighted earlier: treat pretreatment as integral to water purification rather than just a checkbox prior to membrane operation. Skip that discipline and membrane lifespan becomes a matter of luck. Good-quality feed to the membrane has to be maintained consistently over time, not just at start-up — that consistency is what keeps a system out of the failure modes described in the next section.
💡 Pro Tip, When a CIP Recovers Performance vs. When It Doesn’t
If the pressure differential has increased recently, it is normally resolved by a CIP to the system. Often, this is related to an event such as a filtration failure, or an unusual event that causes excessive fouling. However, if the pressure has been increasing slowly and there has been no apparent event then a clean-in-place (CIP) operation would be of little benefit and more than likely will indicate significant fouling and/or scaling is already permanently embedded within the structure of the membrane. In this case it would make far more economic sense to plan on replacement, rather than the expense and downtime of several consecutive clean-in-place cycles as they themselves are very expensive.
When Pretreatment Alone Isn’t Enough, Common Failure Modes
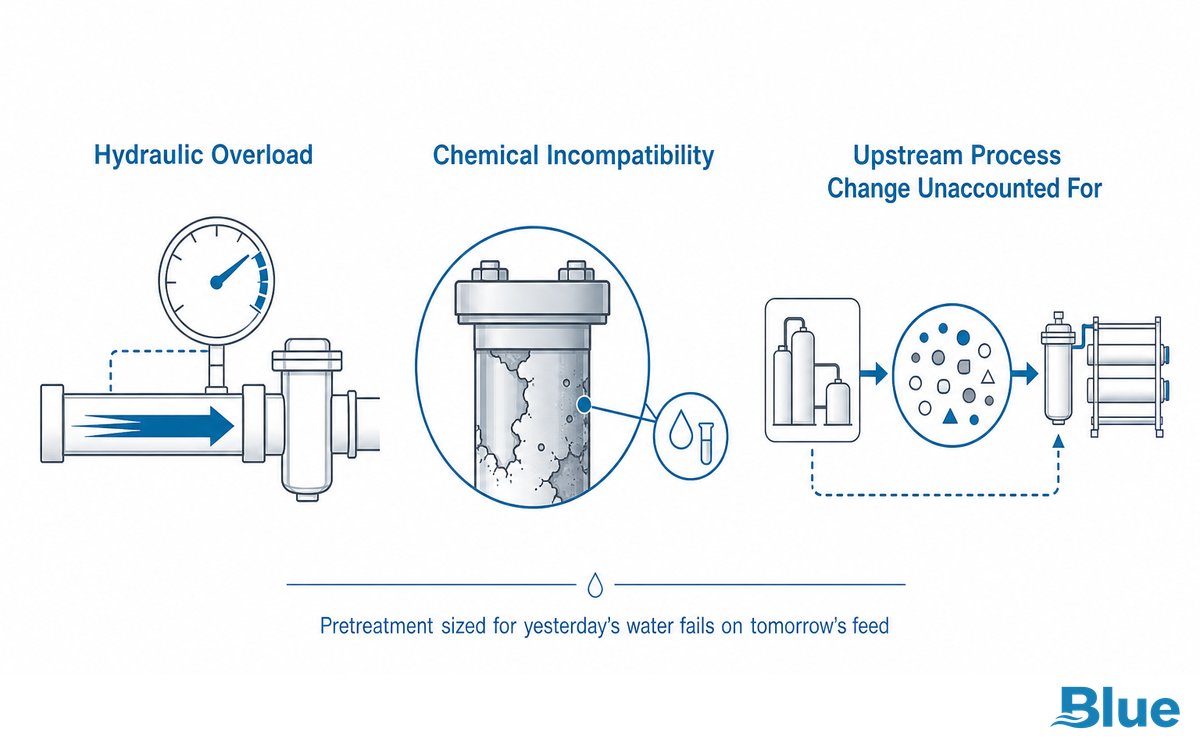
Fouling can be substantially minimized with pretreatment; however, even the optimum design of a 4-stage system can’t completely negate the risk, especially in instances where the chemistry varies rapidly throughout the year (i.e., seasonal water, blended water sources, or intermittent wastewater-reuse streams). This can cause problems in a system calibrated to average conditions, and practicing engineers running RO systems report seeing it happen in the field where pretreatment specifications were designed based on a snapshot of water quality rather than on an average.
Two other scenarios exist in which you’ll want to look beyond pretreatment alone: the need to scale pretreatment up considerably for wastewater-reuse applications with a biologically intensive waste stream, and legacy systems that were originally specified correctly with the correct pretreatment train but haven’t been reconsidered since a source water change. A 2023 peer-reviewed review of municipal wastewater-reuse RO concentrate management documents the same underlying issue from the concentrate side: reuse streams elevated in TDS, metals, and micropollutants push RO trains beyond what a pretreatment design calibrated for average feed conditions can absorb, reinforcing why these applications need their own recalibrated design rather than a scaled-up standard train. These may be as simple as a well that was only tested once during its installation but has never been tested again since it has begun experiencing water level drawdown and quietly compounding damage over time. For both these situations, a more active treatment isn’t the solution — a new water analysis and a recalibrated system are required. In every case, effective pretreatment that’s periodically re-matched to your actual feed water is what keeps an advanced RO system delivering consistent water quality and long-term reliability, rather than an expensive surprise a few years in.
Frequently Asked Questions
Q: Can we use RO without a pre-filter?
No, running an RO system without a pre-filter voids most membrane warranties and shortens element life fast.
Even in visually clear water, small suspended particles can build differential pressure across lead elements, and if they aren’t removed, unoxidized free chlorine can begin to slowly damage thin-film composite membrane elements. If you do not have adequate pretreatment, the absolute minimum requirement for industrial applications is cartridge filtration rated for at least 5 microns plus dechlorination; in many instances, an antiscalant skid and an SDI of less than 5 before water enters the membrane housing are also required for high-loading sources.
Q: What is a major downside of reverse osmosis water treatment without proper pretreatment?
The major downside is accelerated, often irreversible membrane fouling that drives up replacement cost.
When pretreatment treatment is bypassed or insufficient, it can allow particulates, scale-forming ions, and even the organic loading to enter the membrane directly, which will increase differential pressure, reduce the normalized flux, and drastically decrease the lifespan of your membrane elements. Studies of more than 500 membrane elements returned by customers indicate that roughly 60% of membrane fouling is attributed to inadequate feed pretreatment and not the membrane elements themselves, a proprietary internal figure, not an externally-published industry statistic.
Q: How much does industrial RO pretreatment equipment cost?
Costs vary widely by feed water quality and system capacity, typically $50,000-$500,000 for a mid-size installation.
The tiered pricing above references third-party industrial RO system estimates for the skid itself, not a standalone quote for pretreatment alone: small systems that supply up to 10,000 GPD run $15,000-$50,000, mid-range systems that deliver 50,000 to 100,000 GPD run $100,000-$300,000, and large industrial facilities with over 500,000 GPD capacity may require $1M and higher. Per that source, storage tanks, pretreatment media, post-treatment, and installation labor add to those figures rather than being included in them. Since the overall cost of your pretreatment is generally more sensitive to feed water chemistry, not membrane count, we highly recommend first performing a site-specific water analysis before requesting vendor pricing — refer to the “procurement” section above for the full vendor selection guide.
Q: How do you purge a reverse osmosis system?
Purging flushes the membrane housing with low-pressure permeate or feed water to clear concentrated ions and preserve membrane condition.
In the membrane, a “purge” cycle at shutdown washes the highly concentrated brine out of the housing to prevent scaling from precipitating in the housing during periods of no usage.
Q: How do you predict scaling and corrosion in circulating water systems?
A saturation index calculation, such as the Langelier Saturation Index, predicts whether water chemistry favors scaling or corrosion.
Similar reasoning also applies to RO system concentrate streams, since these ions become many times more concentrated relative to the feed water — which is why antiscalant dosing is calculated against concentrate-side chemistry, not feed chemistry.
Q: Is industrial RO pretreatment the same as the EPA Industrial Pretreatment Program?
No, they’re two different meanings of the same word.
The EPA’s National Pretreatment Program (40 CFR 403) addresses how industrial facilities discharge their wastewater to a public sewer. This guide covers the use of “pretreatment” to mean the multimedia filtration and/or cartridge filter, the antiscalant dosing, and the dechlorination step used to protect the RO membrane’s feed water — not the wastewater process under regulatory authority.
Why We Write This
Properly designed pretreatment is what lets a plant maintain reverse osmosis membrane performance and deliver high-quality water across the system’s full lifecycle, even as feedwater conditions and contaminant loads shift over time. At Blue Membrane we manufacture our own RO and nanofiltration membrane sheet and spiral-wound elements for industrial reverse osmosis systems; therefore our technical team inspects returns directly rather than relying on secondhand fouling reports. The autopsy data and Z1/Z2 operating limits cited throughout this guide derive from this process — if a number presented here is proprietary (rather than a public industry specification), it’s identified as such. Reviewed by the Blue Membrane technical team.
References & Sources
- Overview of Drinking Water Treatment Technologies U.S. Environmental Protection Agency
- Review of Reverse Osmosis Membrane Fouling Mechanisms PubMed Central, National Institutes of Health
- Comparison of RO Fouling-Prediction Indicators (SDI/MFI Sensitivity to Biological Fouling) PubMed Central, National Institutes of Health
- Cost of Fouling in Full-Scale Reverse Osmosis and Nanofiltration Installations in the Netherlands Desalination (Elsevier), Jafari et al., 2021
- Antiscalant Formulation Patent US20220331742A1 Google Patents / USPTO
- ASTM D4189-23: Standard Test Method for Silt Density Index of Water ASTM International
- A Comprehensive Review of Reverse Osmosis Desalination, published in Desalination and Water Treatment (Elsevier), Tayeh et al., 2024
- Variable Operation of a Renewable Energy-Driven Reverse Osmosis System Desalination (Elsevier), Mito et al., 2022
- The Future of Municipal Wastewater Reuse Concentrate Management PubMed Central, National Institutes of Health, Finnerty et al., 2023
Related Articles
Not sure which pretreatment train fits your feed water?
Meet Blue Membrane’s technical team and let’s discuss matching your water analysis with the proper RO or nanofiltration configuration.