
Get in touch with Blue Membrane Company


The silt density index measures how rapidly a small test filter becomes restricted by a water sample. It’s used by engineers to test the particulate fouling potential before reverse osmosis. A useful result is comprised of more than just a number. The sample point, test time, plugging percentage, and the membrane feed limit must agree.
Updated October 2026
A low reading can assist in assessing pretreatment performance. It can’t clear all causes of membrane fouling and a high reading can’t pinpoint the failed component. This manual follows the measurement up to the point of purchase and includes illustrative calculations.
SDI test essentials
| Test filter | 0.45 µm microfiltration membrane |
|---|---|
| Test pressure | 30 psi, approximately 207 kPa |
| Common collection volume | 500 mL, identical for the initial and final collection |
| Report label | SDI15, SDI10 or SDI5, matching the elapsed interval in minutes |
What the Silt Density Index Measures
What is the silt density index?
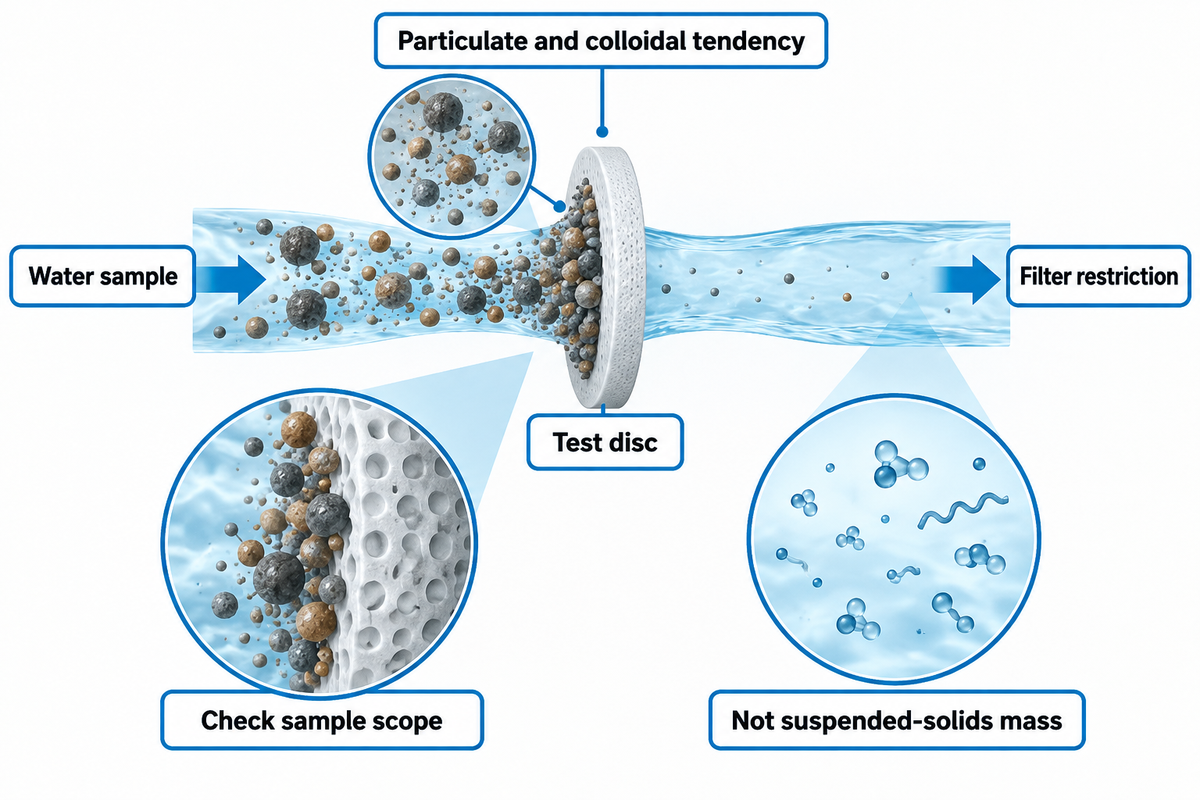
Silt density index is an empirical measurement of filter-plugging to assess the particulate and colloidal fouling tendency of water for the RO and NF application. The standard test compares the time needed to collect an equal water volume before and after a defined filtration interval. It doesn’t measure the mass of suspended solids.
Longer collection times are attributed to a clogged membrane filter. The resulting index describes that change under the test conditions. A colloid, iron deposit and an organic particle can affect the filter differently. Equal solid concentrations do not necessarily lead to equal results. ASTM D4189-23 clarifies that particle size, shape and nature prevent an absolute quantity measurement.
The ASTM D4189-23 public scope will allow you to apply the method to waters less than 1.0 NTU turbidity. It also excludes D1193 Type I, II and III reagent-grade water and effluents from most reverse osmosis and ultrafiltration systems. Be certain of scope when choosing a test for very clean waters; do not assume every UF filtrate fits the scope.
From a treatment operator’s viewpoint, the important question is, does the sample represent the water which will contact the elements? Clearly label an intake sample and an RO feed water sample separately. Making a good measurement can result in a poor equipment decision if it describes the wrong process point.
How to Perform an SDI Test
How to perform SDI test?
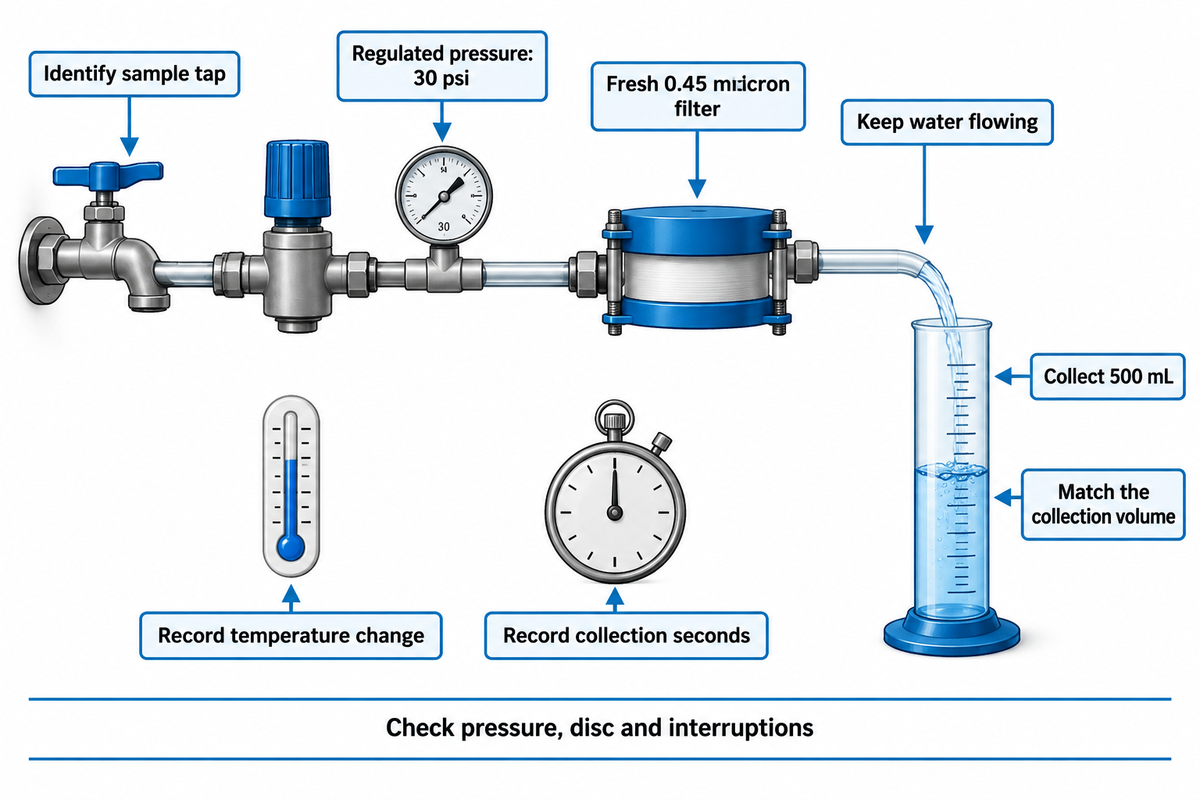
Perform an SDI test with a clean filter holder, a fresh 0.45 micron filter and regulated water pressure. Flush the sampling connection, remove any trapped air, and take the temperature. Measure the time and the volume removed. Leave filtration running between measurements and repeat at the intervals chosen.
A manual kit usually includes a regulator and gauge, membrane filter holder, graduated cylinder, thermometer, stopwatch, and tweezers. Constant water pressure matters: a pressure change alters flow through the filter and can resemble a change in water quality.
- Identify the sample. Record the tap location, operating flow and whether the plant is steady, starting up or recovering from a backwash.
- Prepare the apparatus. Flush it, check the seal, handle the disc without touching its working surface and bleed air from the holder.
- Set the pressure. Stabilize the pressure of 30 psi and verify it during the run.
- Measure the initial collection. Record the seconds needed to collect 500 mL. Leave the water flowing.
- Measure again. Record the same collection volume at 5, 10 and 15 minutes where the method remains usable.
- Check the conditions. Record final temperature, pressure, filter identity and any interruption before calculating the index.
Maintain initial and final water temperatures within the specified range in the procedure. The method published by Hydranautics uses a maximum temperature change of 1°C. Don’t shut off the flow during the waiting period. Starting the flow to fill the cylinder makes a different run history. The University of Twente’s SDI research summary provides more information on the test conditions and explains some of the measurement methods.
SDI Calculation: Keep Seconds and Minutes Separate
How do I calculate the silt density index (SDI)?
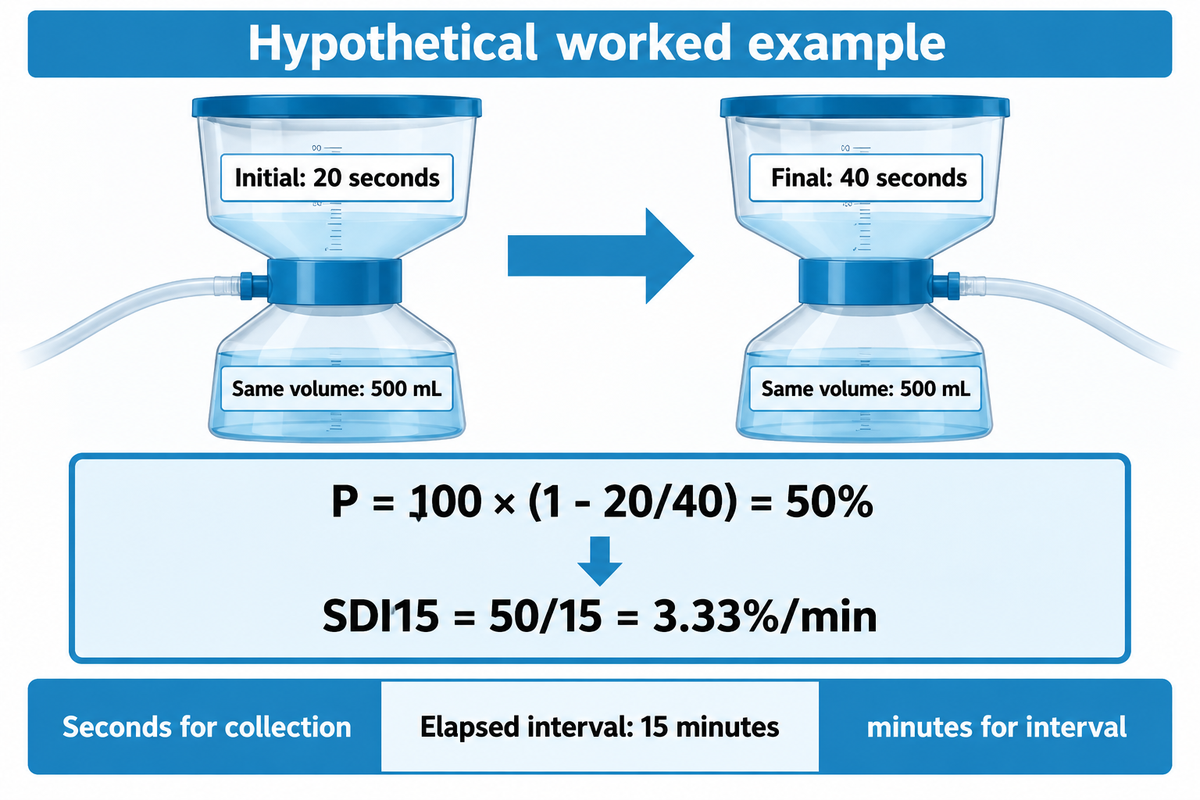
Calculate SDI as follows: SDI = 100 (1 – ti/tf) / T, where the collection time is in seconds, and T is in minutes. The subscript identifies the interval, not the volume of the cylinder being filled.
Plugging factor, P = 100 × (1 − ti/tf)
SDIT = P / T
Initial collection time ti: seconds. Final collection time tf: seconds for the same volume. Elapsed interval T: minutes.
The ratio ti/tf compares collection rates indirectly because the collected volumes match. Using 900 seconds as T instead of 15 minutes also changes the answer by a factor of 60.
Let’s say we have an operator who’s testing a stable feed sample. The first 500 mL takes 20 seconds; the same volume takes 40 seconds at the 15-minute observation. The ratio is 20 ÷ 40 = 0.5, so P = 100 × (1 − 0.5) = 50%. Dividing 50 by 15 gives an SDI15 of 3.33%/min. The operator records both raw times rather than just “3.33.” A second person can now reproduce the arithmetic, check the 50% plugging result and compare the reading with the chosen element’s feed requirement. The result is helpful for the comparison; it isn’t an estimate of when the next cleaning would be required.
The plugging percentage and the index belong on the report. A calculator that gives a green or red answer leaves out the measurement checks needed to justify the answer. The calculation and plugging limit follow the published Hydranautics procedure.
Is This SDI Result Valid Enough to Compare?
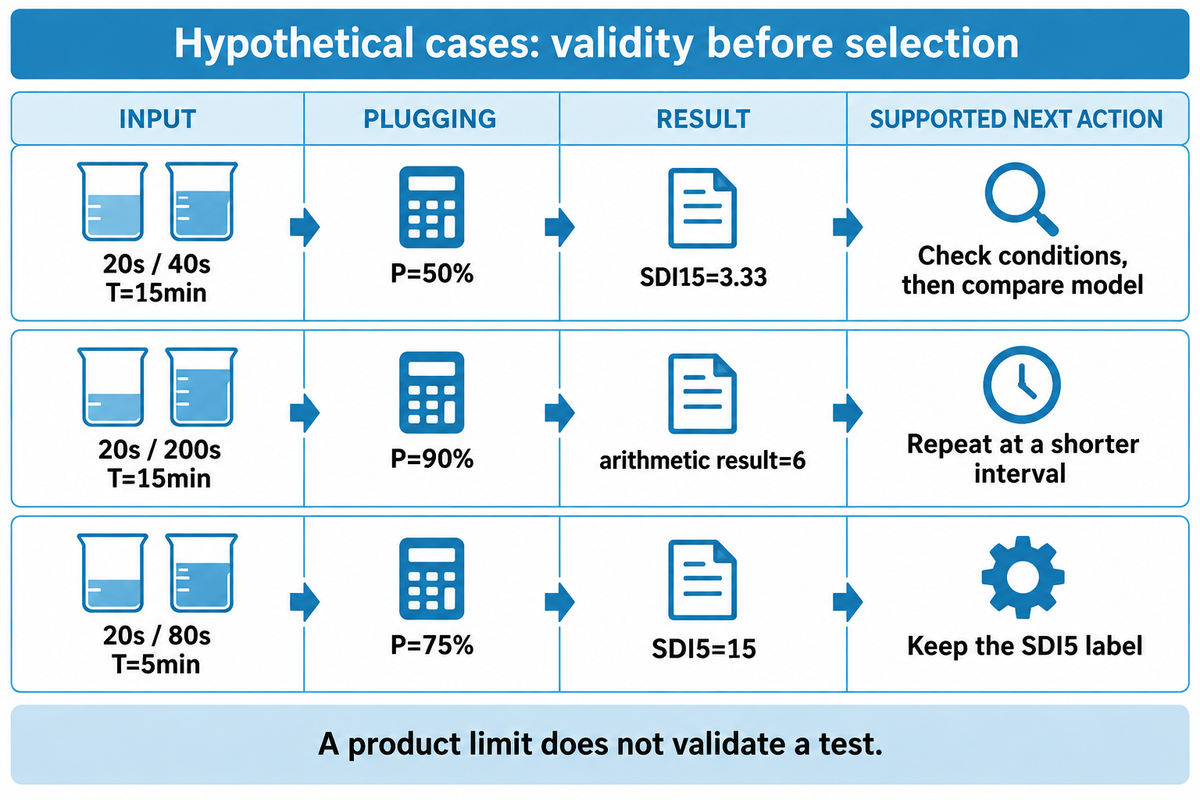
Check sample suitability, pressure, temperature, filter identity and plugging before comparing an SDI result with a feedwater limit. The published test procedure calls for plugging not to exceed 75%; a larger value requires a new test using a shorter interval. An answer to a math problem can be correct; however it may not be in the range of acceptable accuracy.
For a 15-minute test, 75% plugging corresponds to 75/15 = 5. Complete plugging corresponds to 100/15 = 6.67. For a test of 5 minutes, plugging would correspond to 100/5 = 20. A test can be shortened; however, the label and observation window must be adjusted accordingly. An SDI5 isn’t the same as an SDI15.
Same SDI, Different Decision
The cases below illustrate separate calculated results from choices that the data at hand justify.
| Record class and case | Calculation | Next decision |
|---|---|---|
| 20s initial, 40s final, T=15min | P=50%; SDI15=3.33 | Check other method conditions, then compare with the specified feed limit. |
| 20s initial, 200s final, T=15min | P=90%; arithmetic result=6 | Repeat at a shorter interval; do not accept this as an accurate SDI15 result. |
| Valid 15-minute boundary: 20s/80s, T=15min | P=75%; SDI15=5 | Check the full procedure and the exact model’s operating target. |
| Valid shortened interval: 20s/80s, T=10min | P=75%; SDI10=7.5 | Keep the SDI10 label; obtain an agreed duration-specific comparison. |
| Invalid shortened interval: 20s/100s, T=10min | P=80%; arithmetic result=8 | Repeat at a shorter interval rather than relabeling it as SDI15. |
| Valid 5-minute boundary: 20s/80s, T=5min | P=75%; SDI5=15 | Preserve the five-minute duration; this is a different index from SDI15. |
| Lower valid reading: 30s/45s, T=15min | P=33.33%; SDI15=2.22 | Continue wider feed assessment; low particulate restriction does not clear other risks. |
| A report says “SDI=3” without duration | Plugging cannot be reconstructed from the report. | Recover the raw times and interval before making a like-for-like comparison. |
| Two SDI15 readings sit on opposite sides of a model limit | A small difference may include test variation. | Repeat under matched conditions and retain the spread of readings. |
Now imagine a buyer gets the second case above, and a membrane page with a feed limit of 6. Matching these two numbers seems convenient. However, the test has reached 90% plugging, which is above the limit at 75%. Thus, the calculated result can’t settle the choice. The right course is to retrieve the previous measurements or repeat the test with a shorter interval, and maintain the actual duration. The buyer then can compare a complete report with the supplier’s stated acceptance method. Buying a more accepting element at this point would not resolve the measurement problem and may be spending money before verifying the feed condition.
SDI may vary with temperature and the membrane filter manufacturer. In its public significance statement, ASTM, warns that results at different temperatures “may not necessarily be comparable.”
Compare readings only after checking the measurement conditions: values at different temperatures “may not necessarily be comparable.”
Matching the filter brand alone does not remove uncertainty. A 2011 study of test-membrane properties found variation within a batch as well as between filter types. Repeat a borderline reading rather than treating its last decimal place as a firm water-quality distinction.
Typical SDI Values and Test Validity
What is considered a high SDI?
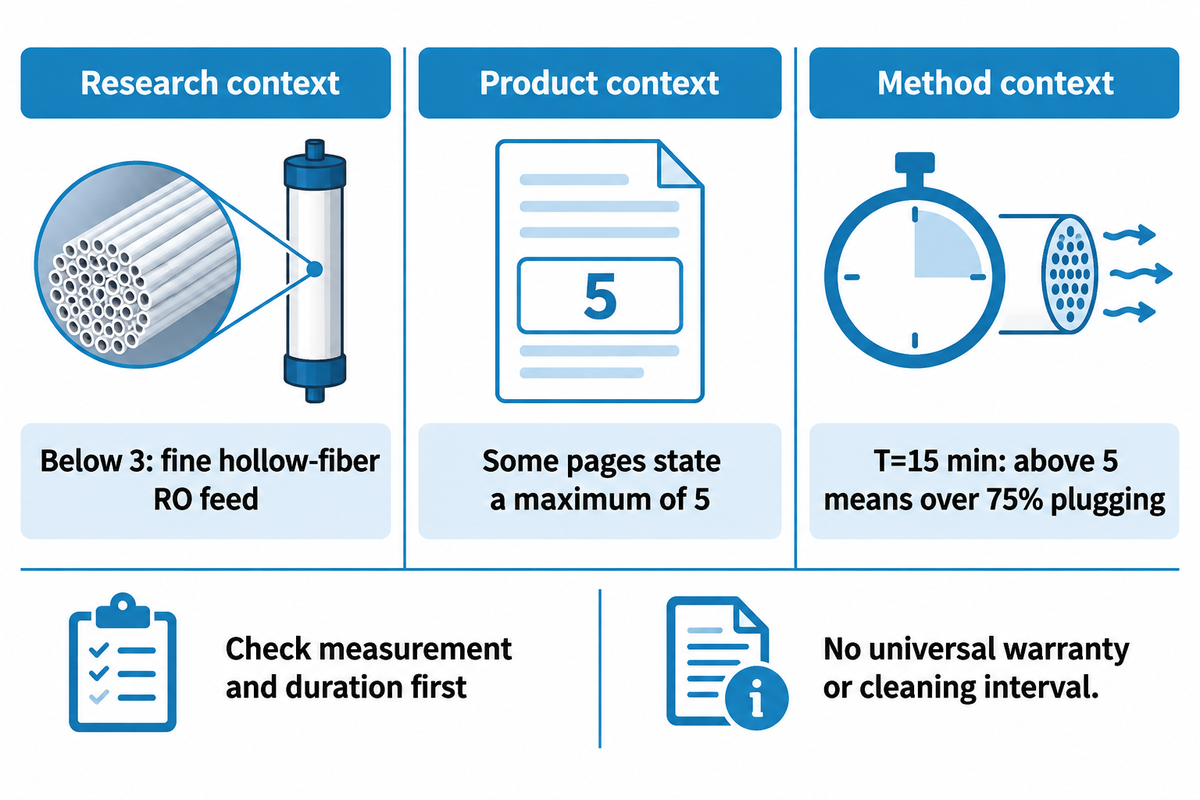
A high SDI is a value that is above the feed limit specified for the chosen membrane and water source once the test itself is valid. Values below 3 are considered a pretreatment design reference for fine hollow-fiber RO feed water in the cited university research, while some product pages state a maximum value of 5. Neither number establishes a universal cleaning interval or warranty condition.
The distinction is important at the higher levels. With T = 15 minutes, a result above 5 indicates more than 75% plugging based on the formula used here. First confirm your measurement and duration. The supplier’s operating limit provides an answer to the separate question about the membrane element, and should be read in conjunction with the stated feed conditions.
For a plant trending toward its target, use a repeatable baseline, and capture the spread of the results. A change from one sample should trigger a review of process conditions before a change in the process. An SDI of 3 from an intake sample, and the same number after final filtration, represent different points in the treatment train. The University of Twente research summary discusses pretreatment design references and the limitations of the index.
SDI vs Turbidity, TSS and MFI
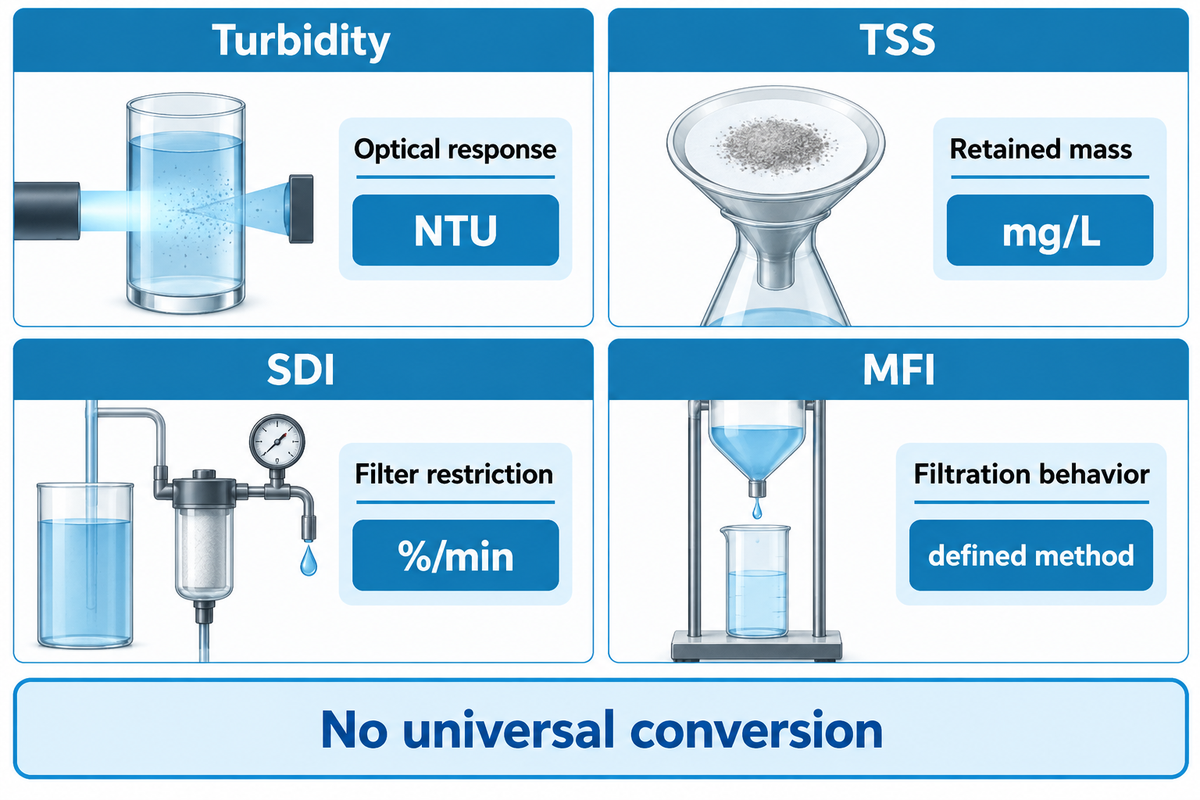
Turbidity and suspended solids measure different responses: optical response and retained mass. The SDI measures filter restriction. MFI uses behavior of filtration to assess particulate fouling. These measures address different questions, therefore a low turbidity or TSS value cannot be generalized to a universal SDI value.
The ASTM D8002-24 public description of MFI is cited to explain the existence of a different fouling index method. SDI has a non-linear relationship with particulate loading. A 50% reduction in the index does not imply that 50% of the particles have been removed.
Controlled experiments also show that foulant mixtures can affect the two indices differently. A 2025 study of particle size and foulant concentration found MFI-0.45 more responsive than SDI in its laboratory mixtures. This supports the consideration of taking a second measurement when a change is not captured by a single index. However, it does not provide a universal conversion, and thus, does not demonstrate field performance of a specific pretreatment unit.
When comparing samples in a lab for equipment purchase, the test method should be stated next to each result. Group SDI values obtained under matching conditions together. Keep mg/L, NTU and %/min in different columns. Treat an automated instrument’s reported “fouling capacity” or “fouling propensity” as a defined output, and examine it rather than assume it is a synonym for the same measurement.
Why the SDI Value Rises
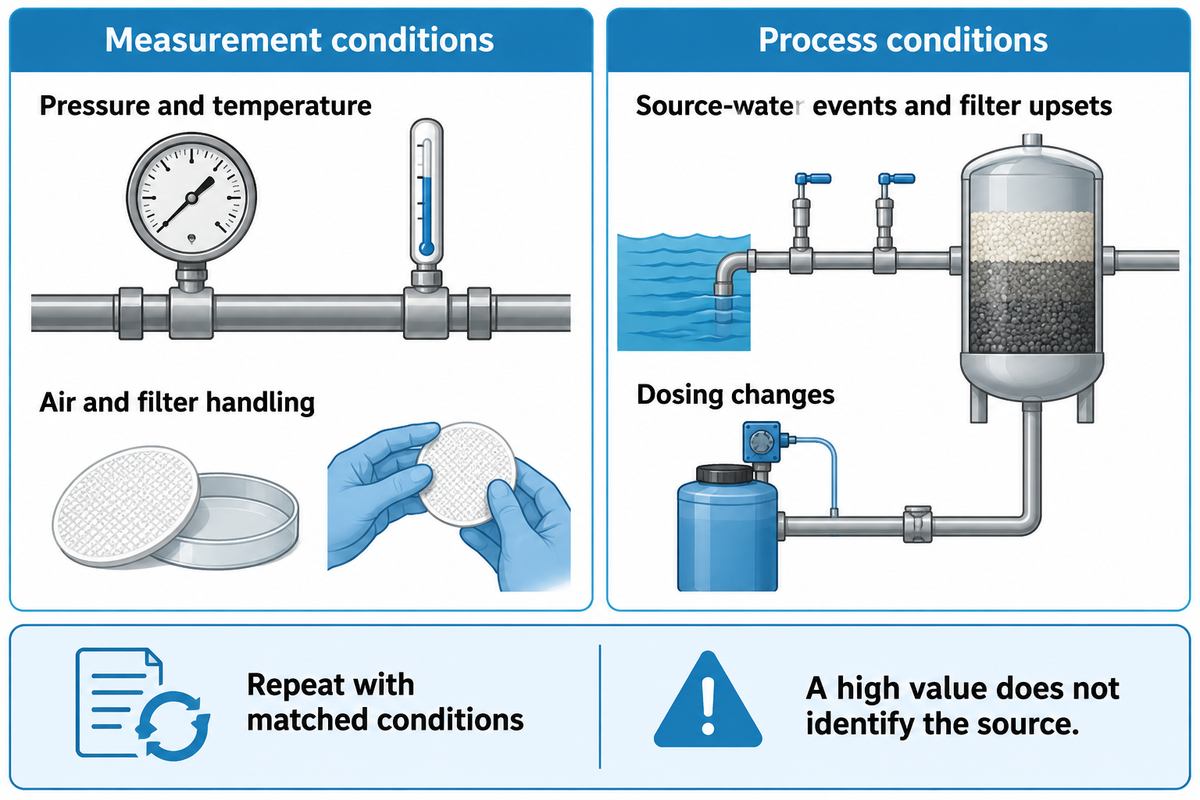
An increased SDI value can happen because the sample clogs the test filter faster, or because the measurement conditions have changed. Consider both possibilities. Check pressure, temperature, and the air and filter handling first. Then compare properly labeled samples at different stages of pretreatment. A high value does not indicate the source of the material.
Possible sources of silt include fine mineral particles, organic colloids, iron corrosion products and precipitated iron hydroxide. The mixture can vary with source-water events, filter upsets, or a change in dosing. Appearance alone cannot tell which constituent is restricting the disc.
Repeatability is especially valuable after backwashing. One full scale study showed variations in particulate indices during the maturation of filters. Mark such samples separately from ordinary operations so short events do not go unnoticed and become part of an “unknown normal” baseline.
Look first at the simplest observations. Is the sample tap clean? Does the regulator hold pressure? Does the trend repeat with a fresh disc? If a change in the process occurs and persists with matched conditions, look at the upstream process. Research on SDI, pressure and membrane resistance found that high readings after UF did not always indicate failed UF equipment. Use more than one process variable to understand why an operation is behaving the way it is.
How to Reduce SDI Without Hiding Another Risk
It is important to recognize where particulate control is lost and then correct that stage’s performance to decrease SDI. Paired samples before and after filtration can help locate a change when the test conditions match. There are a number of treatment options including coagulation, media filtration, microfiltration, and ultrafiltration. However, the choice among the options depends on feed chemistry, operating duty, and the index.
During pre-treatment evaluation, compare water from the same operating period. Record flow rate, backwash timing and condition, and other relevant information with the samples. Filtration systems may behave differently during startup and steady state. A finer cartridge may capture different materials without correcting the upstream cause. For a treatment train discussion, refer to our Industrial RO pretreatment guide. This article will focus on what the measurement supports.
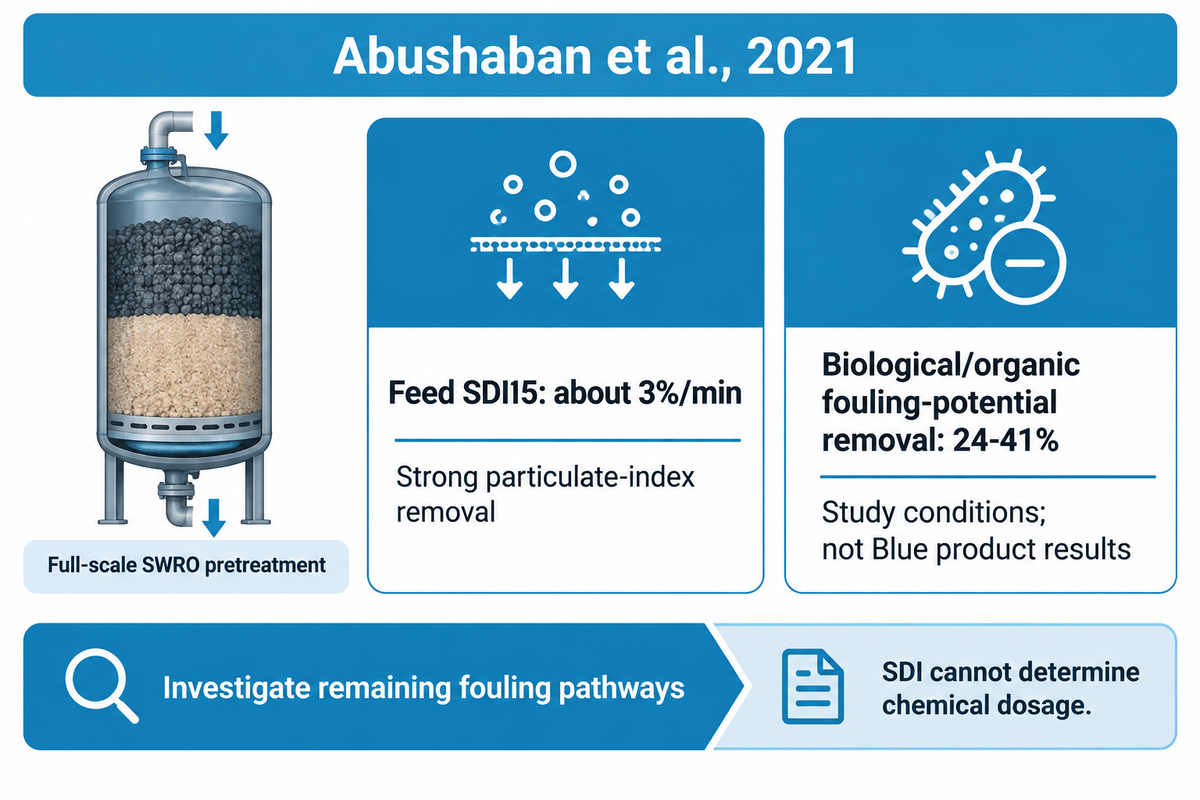
A published seawater RO case shows why a better particulate index is only part of the decision. Abushaban and co-workers monitored a two-stage dual-media pretreatment at a full-scale desalination plant. The final SWRO feed had an SDI15 of about 3%/min, and biological and organic fouling-potential indicators were removed much less than the particulate indicators. A plant manager seeing that combination would keep the particle-control result and investigate the remaining fouling pathway. Ordering extra cartridges solely to push the number lower could add replacement work while leaving the biological issue untouched. The goal is to widen the diagnosis before spending on an incorrect restriction mechanism.
The 2021 full-scale pretreatment study reported strong particulate-index removal but only 24–41% removal of biological/organic fouling potential under its operating conditions. Results reported belong to that study and not to the Blue Membrane products.
For membrane systems, including reverse osmosis systems with low readings but worsening pressure drop or output, investigate biological fouling, organic fouling and scaling alongside particulate fouling. The change of chemical dosage or cleaner chemistry requires an appropriate analysis of water quality, and should be performed in accordance with the manufacturer instructions of membrane. SDI cannot determine the chemical dosage.
The SDI Result-to-Decision Record
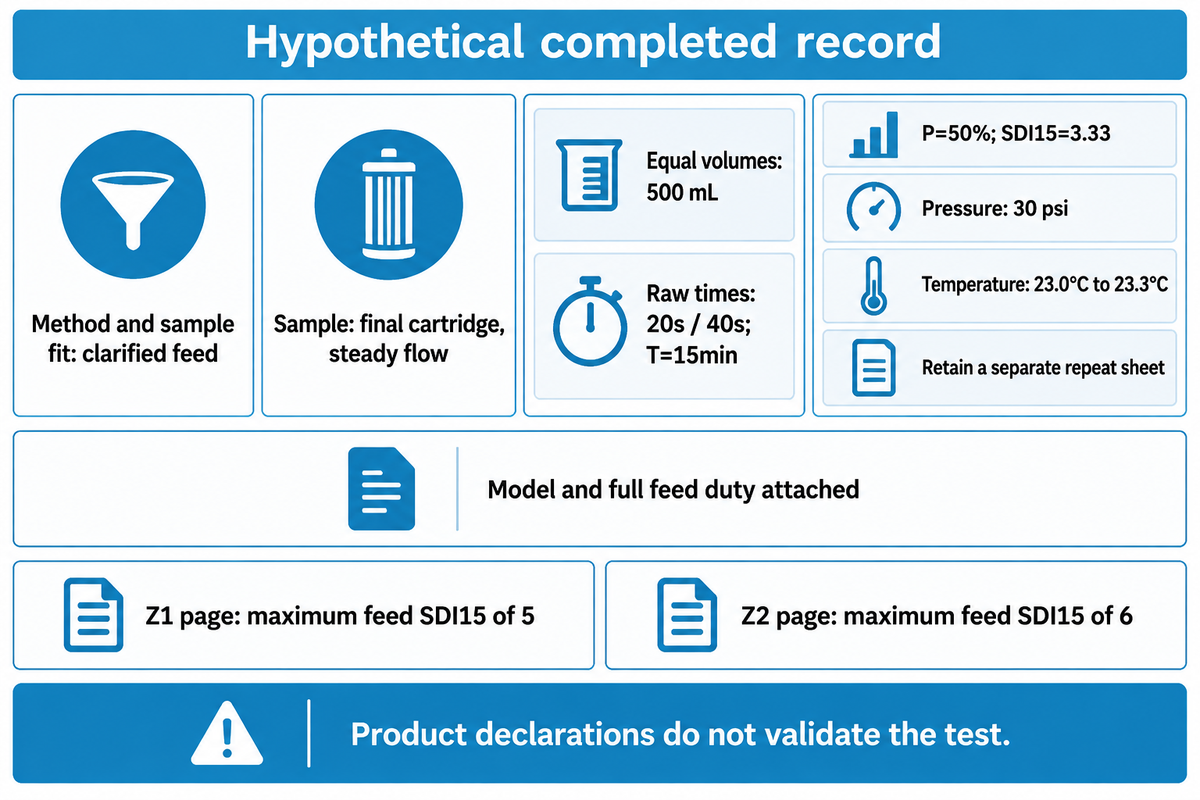
A helpful SDI record connects the raw test to the action it supports. Give the operator repeatable measurements, the water quality reviewer a validity check and the procurement officer a specified membrane requirement. The five checks below prevent missing a test duration or sample location from resulting in an unnecessary element or pretreatment purchase.
| Check | Filled example | Decision supported |
|---|---|---|
| 1. Method and sample fit | Manual SDI procedure; clarified feed sample within the method’s scope. | Use this method for the identified water sample. |
| 2. Sample point and condition | After final cartridge, steady flow; before RO high-pressure pump. | Compare with the requirement for water entering the elements. |
| 3. Matched collection and interval | 500mL both times; 20s/40s; T=15min. | Reproduce SDI15=3.33. |
| 4. Validity and repeatability | P=50%; pressure stable; temperatures and disc lot recorded. | Check all method conditions and repeat a borderline reading. |
| 3. Collection volume | 500mL initial and 500mL final | Keep the flow-ratio comparison on one volume basis. |
| 4. Test pressure | 30psi at both timed observations | Retain gauge readings to check pressure stability. |
| 4. Sample temperature | 23.0°C start; 23.3°C end | Record the 0.3°C change and compare it with the procedure. |
| 4. Repeat sheet | A second run is retained with its own raw times and filter details. | Review the spread before acting on a borderline result. |
| 5. Model and wider feed conditions | Exact element model, published limit, complete feed analysis and design duty attached. | Evaluate product suitability without using SDI as the whole feed specification. |
Fouling-Resistant Membranes: Match the Limit to the Model
Blue Membrane’s Z1 brackish-water membrane page lists a maximum feed SDI15 of 5. Its Z2 fouling-resistant RO membrane page lists 6. These are model-family feed specifications. The larger number does not make a 90%-plugged, 15-minute test accurate or remove the need for pretreatment.
For spiral-wound reverse osmosis membranes, evaluate the element with the full feed report and system duty. Membrane manufacturers also define limits (including temperature and chemical composition) of operation. Separate a quoted feed tolerance from conditions used to evaluate flow and salt rejection; they are different parts of a product specification.
Copy these fields in a quote request. Be sure to include the raw test sheet so the supplier can answer method and model questions in the same review.
RFQ checklist — copy these into your quote request:
| Parameter | Recommended range | Why it matters | How to verify |
|---|---|---|---|
| Sample location | Named RO feed tap; steady operating condition | Matches the element’s actual inlet water | Mark the tap on the process drawing |
| Collection times | Seconds for equal measured volumes | Preserves the flow-ratio calculation | Attach original time and volume records |
| Elapsed interval | Actual minutes, matching the index label | Avoids comparing unlike tests | State the test start and observation times |
| Pressure and temperature | Within the named procedure’s control conditions | Changes can alter the reading | Attach start/end readings and gauge details |
| Filter identity | Specified disc type, maker and lot | Supports repeatability checks | Retain packaging details and repeated results |
| Element and feed duty | Exact model, full water analysis, design flow and recovery | Connects measurement to selection | Confirm the supplier’s acceptance method and model limits |
Make the next decision from the complete record.
Repeat an invalid test. Investigate a persistent change under matched conditions. Compare a valid result with the exact membrane requirement, and check other fouling pathways before buying more filtration equipment.
Have a feedwater report? Discuss your RO membrane selection
Frequently Asked Questions
Can SDI be negative?
A negative SDI calculation means the final collection was faster than the initial collection.
Check the recorded times, matched volumes, air removal and pressure stability before interpreting it as a water-quality change. A shorter final collection time makes ti/tf greater than one, so the formula becomes negative. Repeat with a fresh disc under the same procedure and retain both sets of raw observations. Do not convert the negative result into an especially good feedwater rating.
What is the MFI in water treatment?
MFI is the modified fouling index, a filtration-based measure of particulate fouling.
The method examines filtration behavior rather than reporting the same two-time ratio as SDI. ASTM D8002 describes a constant-pressure MFI method. Keep the procedure and units with the result, because MFI-0.45 and methods using finer test membranes are not interchangeable labels. A laboratory can select the method suited to the water sample and the question about particulate loading; a single universal SDI conversion would lose those conditions.
Are there any SDI test kits available?
Yes. Manual kits and automated instruments are available for SDI measurement.
Check that the kit includes a suitable pressure regulator and gauge, the correct filter holder and a way to collect and time the specified volume. A thermometer and consistent disc supply are also needed. For an automated unit, ask whether it retains raw collection times, sample identification and test conditions. Automation can reduce recording work, but the instrument still needs a suitable sample and a defined test method.
What is the unit of silt density index?
SDI is commonly reported in percent per minute, or %/min.
The percentage comes from the collection-flow reduction and is divided by elapsed minutes. Report the duration too: SDI15 and SDI5 describe different observation windows.
How often should SDI be measured?
Set the routine schedule around feed stability, plant procedures and the selected membrane’s requirements.
Add measurements after source-water changes, pretreatment adjustments or unexplained shifts in pressure drop and output. Keep startup and post-backwash readings distinct from steady operation. A stable plant and a variable surface-water intake need different monitoring plans; one fixed frequency cannot describe both duties.
Our perspective on the feedwater decision
Blue Membrane supplies RO membrane elements and water treatment equipment. This guide connects silt density index testing with the feed information used to select those products. Its calculation examples are hypothetical, while the pretreatment research is attributed to its authors. The practical aim is a clear test record that an operator, water-quality reviewer and buyer can use together. Written by Cherry for Blue Membrane.
References & Sources
- ASTM D4189-23 — public scope and significance
- ASTM D8002-24 — modified fouling index method
- Al-Hadidi, 2011 — SDI limitations, improvements and alternatives
- Alhadidi et al., 2011 — test-membrane properties and repeatability
- Alhadidi et al., 2011 — SDI/MFI relationship and test conditions
- Abushaban et al., 2021 — full-scale SWRO pretreatment study
- Investigation of SDI and MFI responses to foulant concentration and particle size, 2025
Related Articles
- RO membrane replacement guide — connect feed diagnosis with replacement planning.
- Membrane in reverse osmosis — understand the variables behind element performance.
- Seawater RO systems guide — place feed testing within a desalination project.
- Water softening with nanofiltration — distinguish particulate control from dissolved-ion treatment.