Get in touch with Blue Membrane Company

Updated July 2026 · Reviewed by the Blue Membrane technical team.
Nanofiltration vs reverse osmosis is the choice between selective softening and near-total demineralization: nanofiltration (NF) rejects 90–98% of divalent hardness ions at 50–150 psi and lets some minerals through, while reverse osmosis (RO) rejects >99% of almost all dissolved solids at 300–1,200 psi to produce near mineral-free water. Don’t pick between them by their headline rejection numbers; pick based on the duty. Choose incorrectly, and you’ll over-invest on energy or miss your water-quality goals. Here we contrast the two on seven decision-making specifications, then give a simple rule for when NF beats RO.
Quick Specs: Nanofiltration vs Reverse Osmosis
| Pore size | NF ~0.001 µm (MWCO 200–1,000 Da) · RO ~0.0001 µm (<100 Da) |
| Operating pressure | NF 50–150 psi · RO 300–1,200 psi |
| Divalent rejection (Ca/Mg/SO₄) | NF 90–98% · RO >99% |
| Monovalent rejection (Na/Cl) | NF 20–80% · RO >99% |
| Typical recovery | NF 80–95% · RO 50–75% |
| Keeps beneficial minerals | NF partial (monovalent) · RO no |
| Best for | NF: softening, color/organics, sulfate · RO: desalination, high-purity water |
Nanofiltration vs Reverse Osmosis at a Glance
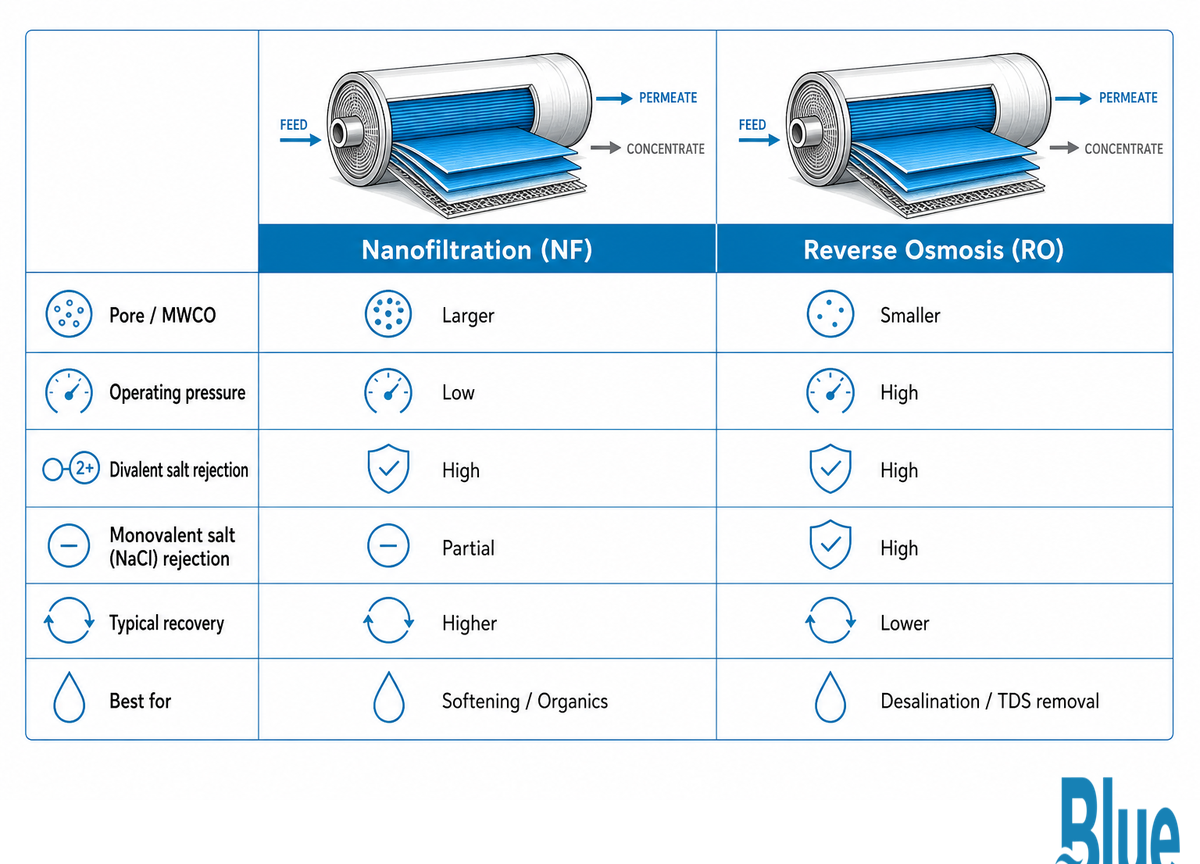
Nanofiltration and reverse osmosis are pressure-driven, spiral-wound membrane processes that appear virtually identical when skid-mounted. Selectivity is the differentiator: NF operates one rung below RO on the filtration ladder, targeting multivalent ions and high-molecular-weight organics while RO focuses on virtually everything dissolved down to single salt ions.
This gap makes all the difference to pressure, energy use, recovery rate and mineral content of your permeate.
50–150 psi
NF operating pressure
300–1,200 psi
RO operating pressure
80–95%
NF recovery
50–75%
RO recovery
| Spec | Nanofiltration (NF) | Reverse Osmosis (RO) |
|---|---|---|
| Pore / MWCO | ~0.001 µm / 200–1,000 Da | ~0.0001 µm / <100 Da |
| Operating pressure | 50–150 psi | 300–1,200 psi |
| Divalent rejection | 90–98% | >99% |
| Monovalent rejection | 20–80% | >99% |
| Typical recovery | 80–95% | 50–75% |
| Product water | Softened, keeps some minerals | Near mineral-free (desalinated) |
Ranges reflect industry consensus.
NF/RO pressure and recovery data were cross-checked against Safe Drinking Water Foundation and manufacturer data sheets. Exact operating ranges will depend on feed water and your required recovery.
Get that one call wrong and the bill lands twice. A brewery that over-specifies reverse osmosis for a simple softening duty pays for pump energy it never needed, then buys a remineralization stage to put back the calcium and magnesium it just stripped; a plant that under-specifies with too loose a membrane misses its hardness target and re-orders. Matching the membrane to the duty is the whole game.
For a peer-reviewed overview of how RO and NF membranes differ, see the NIH review of reverse osmosis and nanofiltration membranes.
How Nanofiltration and Reverse Osmosis Actually Work
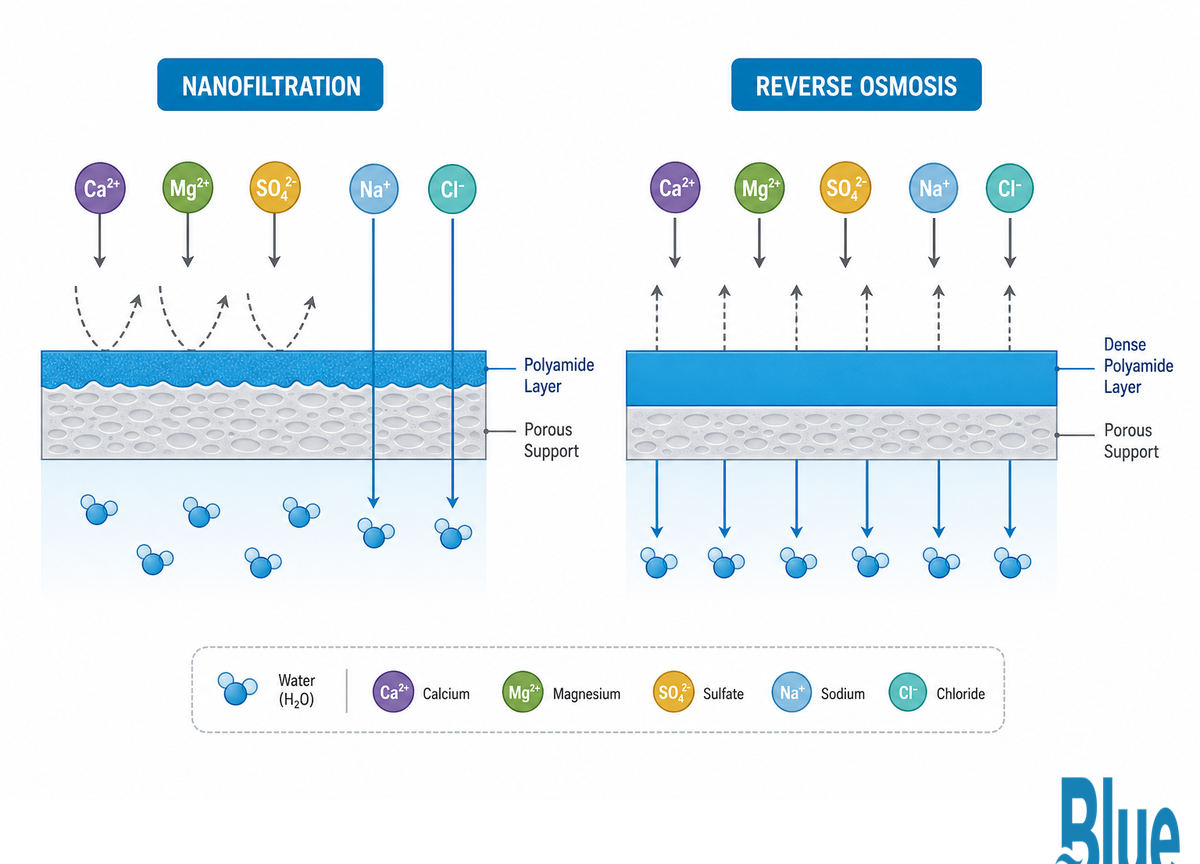
Both processes force feed water against a polyamide thin-film composite membrane under a pressure that exceeds its natural osmotic pressure. Purified water (permeate) passes through the membrane while concentrated rejected feed (brine) is flushed out. The difference in operation lies in pore size and membrane surface charge.
A nanofiltration membrane has pores near 0.001 µm with a molecular weight cut-off (MWCO) of approximately 200–1,000 Daltons. This allows rejection of multivalent ions and large organics, while enabling tunable permeation of monovalent salts. In contrast, an RO membrane has pores of approximately 0.0001 µm with a MWCO below 100 Daltons, restricting almost all dissolved species except water molecules from passing through.
Picture a beverage plant pulling 900 ppm brackish well water. Feeding it to a nanofiltration system pulls out the calcium, magnesium, and sulfate that scale heat exchangers, while letting enough sodium through to keep osmotic pressure — and the pump bill — low. Push the same feed through brackish water reverse osmosis and you chase every last ion, which is where the difference between nanofiltration and reverse osmosis shows up first: the duty an NF membrane handles near 90 psi can demand 200 psi or more on RO. Specifying that RO train for a job the NF membrane would have softened is a common and costly mistake.
Does nanofiltration remove salt?
Partially. Nanofiltration rejects 90–98% of multivalent divalent salts — calcium, magnesium, and sulfate — that cause scaling, but only 20–80% of monovalent salts such as sodium chloride, with that figure controllable through the membrane grade you choose. For this reason NF is described as “selective” or “partial” desalination: it softens and de-organics water without driving total dissolved solids (TDS) to near zero.
If your objective is to remove table salt or reach a very low-TDS permeate, RO is the better choice, since it achieves greater than 99% rejection of both monovalent and divalent salts. (See peer-reviewed articles on RO and NF membrane chemistry for further detail.)
The pressure-driven separation mechanism of both processes is detailed in this review of RO and NF in industrial water treatment.
Where NF and RO Sit: The MF/UF/NF/RO Filtration Spectrum
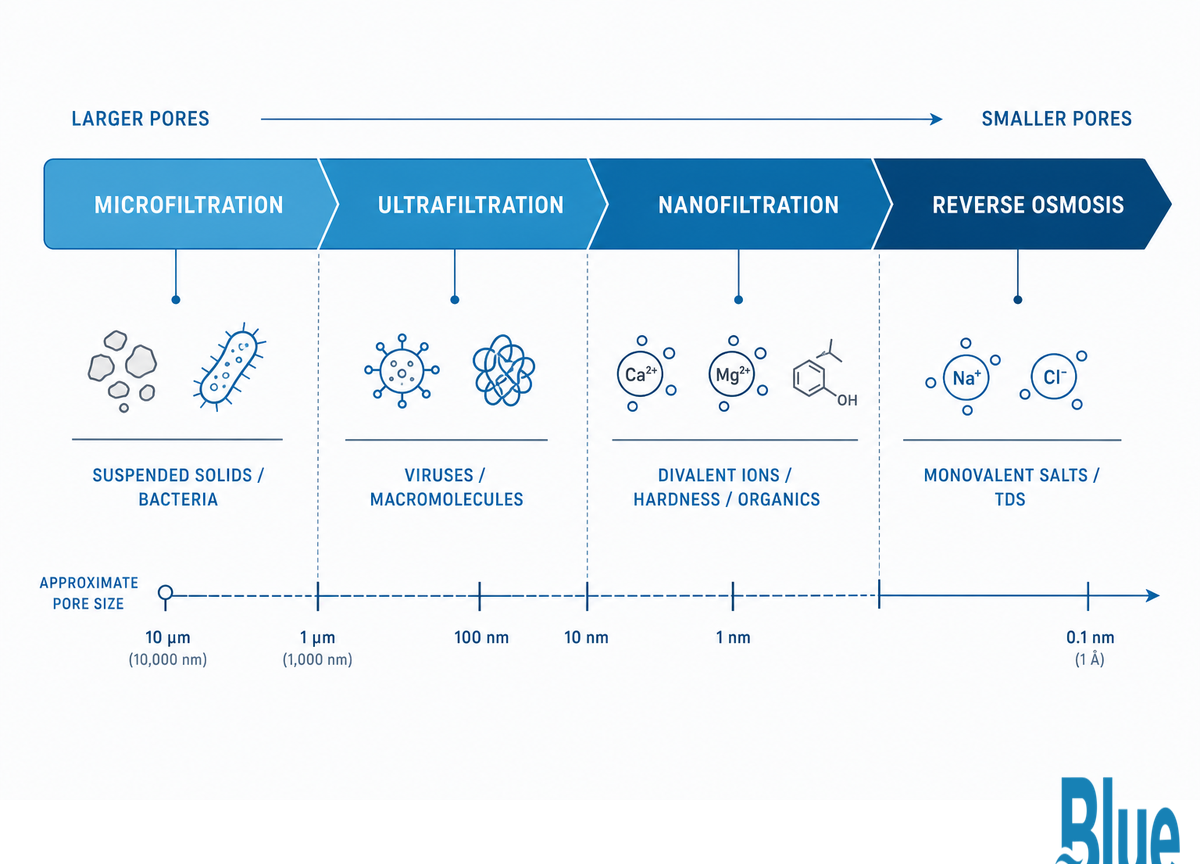
Nanofiltration and reverse osmosis represent the two most tightly constructed members of a four-level membrane technology family. Determining where your duty fits in this hierarchy will help eliminate technologies and simplify comparisons before you look at individual specs.
While microfiltration and ultrafiltration simply filter particles based on size, NF and RO also reject ions based on surface charge.
| Process | Pore size | Removes | Leaves |
|---|---|---|---|
| Microfiltration | ~0.1 µm | Sediment, most bacteria | Viruses, all dissolved ions |
| Ultrafiltration | ~0.01 µm | Bacteria, some viruses, colloids | Dissolved salts and organics |
| Nanofiltration | ~0.001 µm | Hardness, sulfate, color, organics, long-chain PFAS | Much of the sodium chloride |
| Reverse Osmosis | ~0.0001 µm | Virtually all dissolved solids, salt, minerals | Near-pure water |
Pore size specifications are sourced from the Safe Drinking Water Foundation membrane filtration fact sheet.
In practice, this ladder is how an engineer rules options out fast. For nanofiltration water treatment, the target sits at the 0.001-micron rung: hardness, sulfate, and color come out while sodium chloride largely passes. Step down to reverse osmosis only when the job needs near-total demineralization. Most nanofiltration vs ro decisions come down to which rung the feed sits on, and framing an nf vs ro membrane choice this way — by rung, before any datasheet — heads off the reflex of buying the tightest membrane and paying for rejection you never needed.
Membrane pore-size classification is corroborated by the NIH review of RO and NF membranes.
Rejection & Water Quality Head-to-Head
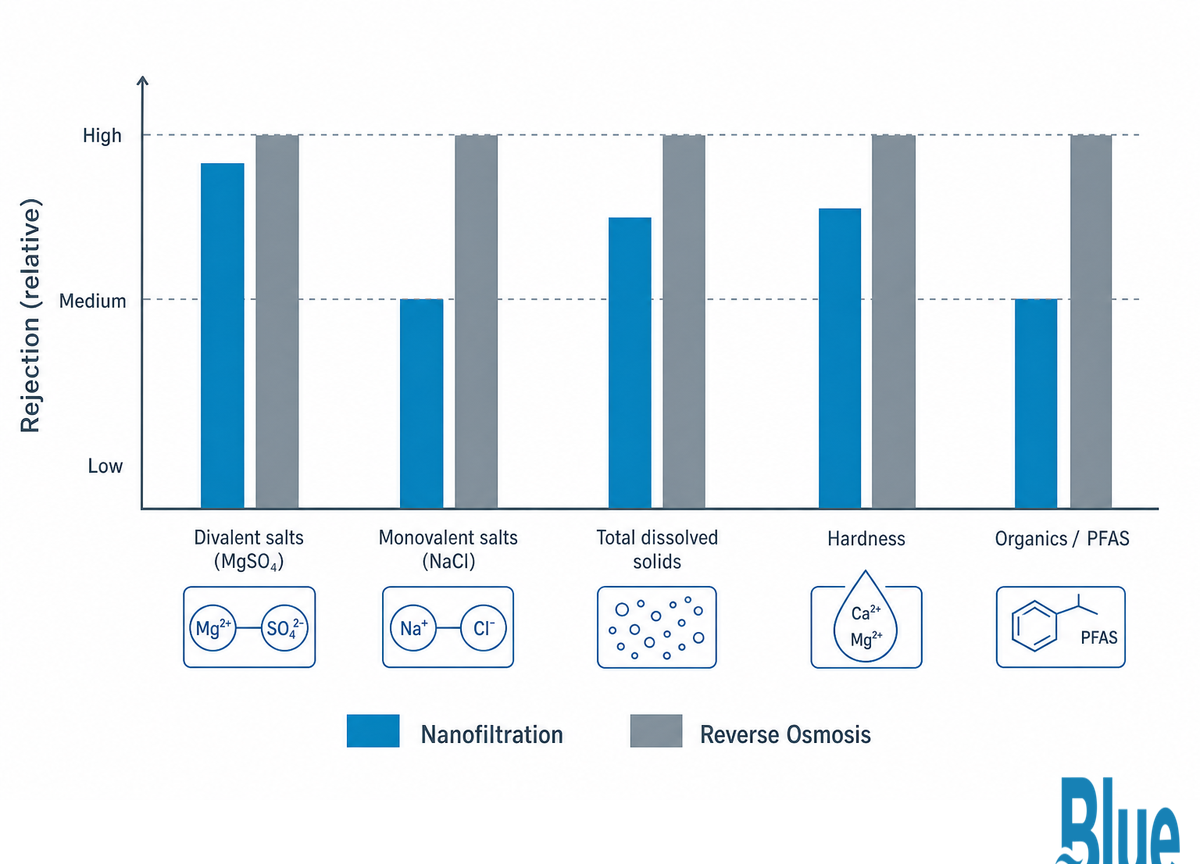
On raw removal power, RO wins every category-but “wins” is the wrong frame. RO rejects both divalent and monovalent ions above 99%, taking TDS down toward zero and pulling out beneficial calcium and magnesium along with the contaminants. NF rejects 90-98% of divalent ions but deliberately lets 20-80% of monovalent salts pass, so it removes roughly 80% of TDS instead of 98%-plus. In a softening or color-removal duty, that “weaker” number is the point: you get soft, low-hardness water without a corrosive, mineral-free permeate that then needs remineralization.
Nanofiltration removes
- Hardness (Ca/Mg) at 90–98%
- Sulfate at 90–95%
- Color, tannins, organic matter (DBP precursors)
- Long-chain PFAS above 90%
Reverse osmosis adds
- Sodium chloride and monovalent salts >99%
- Near-zero TDS permeate
- Seawater-grade desalination
- Removal of beneficial minerals too
Can nanofiltration remove PFAS?
Yes for the long-chain compounds, with an honest caveat for the short ones. High-pressure membranes are among the most effective PFAS barriers available: the U.S. EPA reports that NF and RO are typically more than 90% effective against many PFAS compounds. Short-chain species are the harder case — their rejection is lower and more variable, depending heavily on the specific membrane, the PFAS compound, and the water chemistry.
Where a short-chain compound like PFBS is your target, don’t assume the headline PFAS number covers it; verify short-chain performance on your own feed and pair NF with additional treatment if needed. We would rather flag that up front than oversell a membrane.
📐 Engineering Note
Fouling budget, not just rejection: NF and RO elements typically specify a maximum feed SDI of 5 and free chlorine below 0.1 ppm. Fed hard water without pretreatment, an NF membrane “plugs up faster,” so hold those limits, dose antiscalant, and schedule cleaning. Industrial elements are commonly rated using standardizing practices such as ASTM D4516, and residential RO systems are certified to the NSF/ANSI 58 point-of-use standard.
PFAS removal effectiveness of high-pressure membranes is summarized by the U.S. EPA.
Energy, Pressure, Recovery & Running Cost
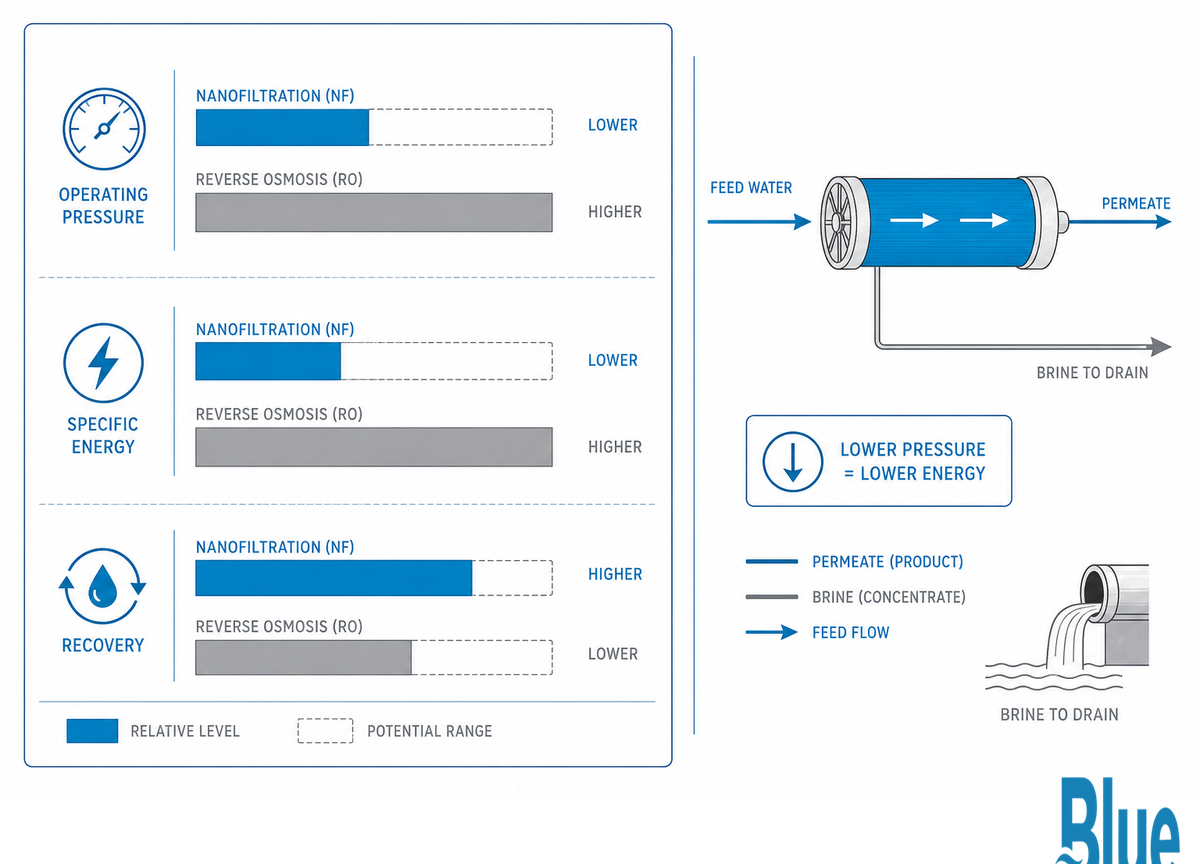
This is where nanofiltration earns its keep. Because NF runs at roughly half the operating pressure of RO, it needs less pump energy per gallon of permeate on the softening duties it’s built for. Industry-typical recovery also favors NF-it commonly recovers 80-95% of feed water versus 50-75% for RO-so it sends less water to drain. Over a year, lower pressure and higher recovery compound into real operating savings, though the exact energy per cubic metre depends on your feed salinity, temperature, and target recovery.
Is nanofiltration cheaper than reverse osmosis?
To operate, usually yes — for the tasks NF was engineered to do. “Oversizing an RO unit for a softening application is a very typical and costly mistake,” says Chris Van Marck, business development director, Asia Pacific, Water at GE Water & Process Technologies. “Higher pressures, lower recoveries: RO costs money on both fronts.”
The difference in recovery rate alone is easy to measure: if your NF runs at 90% and RO at 65% on the same 100 m³ of product water, RO must pump around 154 m³ of feed and NF only 111 m³ — nearly 40% more water to pump, at higher pressure, with much more concentrate sent to drain. Lower-pressure design also means smaller pumps and housings. The caveat: high-TDS and seawater duties need the rejection only RO can provide, and there the energy difference becomes a necessary cost of doing business.
TDS Crossover Band. As a very loose rule of thumb, you can often view most NF-vs-RO issues with the following starting point (this is a heuristic, not an immutable law): for feed TDS of roughly 200 to 1,500 ppm where the removal of hardness and organics are more critical than demineralization, NF will often be the cost-effective solution. Above that range, or anytime you desire near-mineral-free permeate, RO is generally required (with the additional pressure that entails).
The real question still becomes which ions you’re required to remove and at what quality.
Comparative energy and recovery behavior of NF and RO is reviewed in this industrial NF/RO study.
Which One for Your Water? A 3-Question Selector
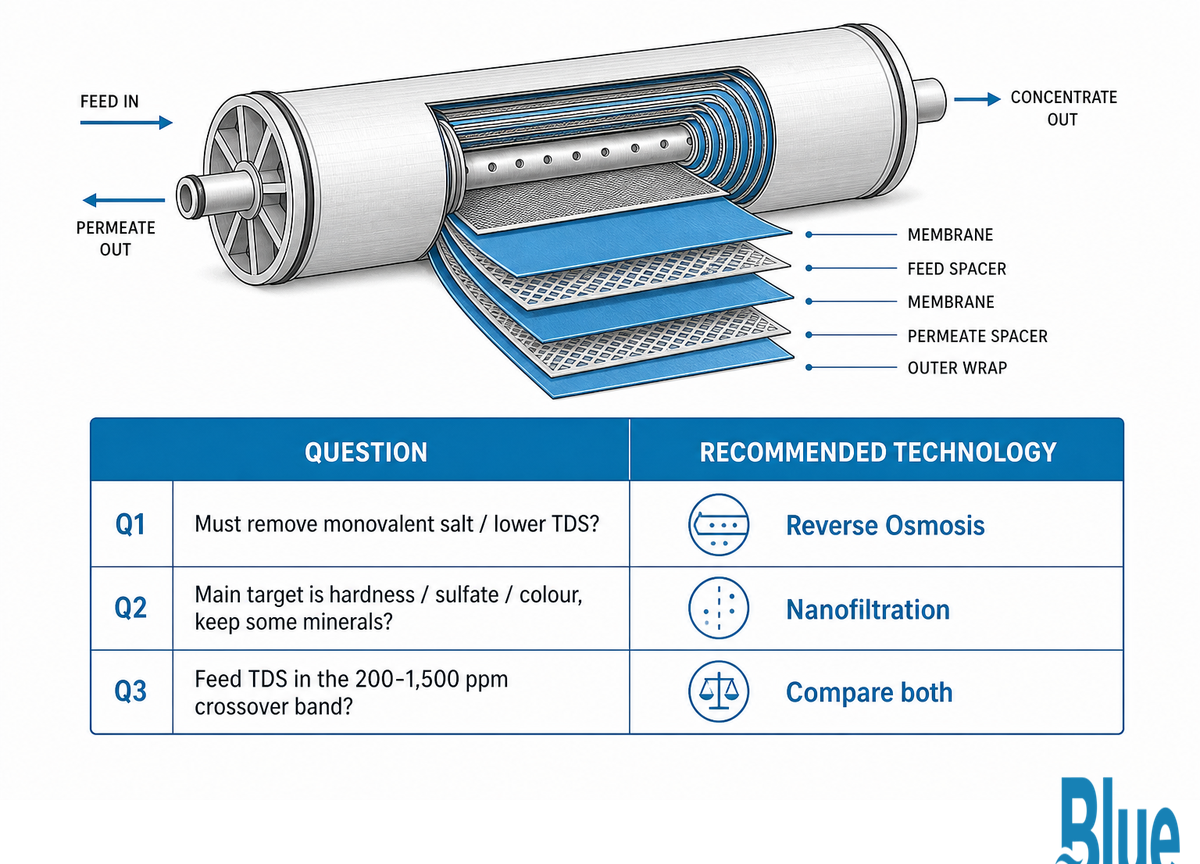
Three questions, asked in sequence, give you a defensible NF-or-RO choice before you ever open a datasheet. Apply them against an actual feed-water analysis, not marketing material — the answers point to nanofiltration, reverse osmosis, or a combined NF-then-RO train. Each question isolates one decision axis: purity target, feed TDS, and whether you want to keep minerals.
The 3-Question NF-or-RO Selector
- So, is it demineralization or softening you require?
Low TDS (boiler feed water, ultra pure water, seawater)?
Go for RO. For removing hardness, sulfate or colour and retaining some minerals?
Then select NF.
- What range does your feed TDS fall into?
For ranges that overlap between 200-1,500 ppm, RO is typically cheaper to operate than NF. Outside of this, RO becomes more favorable.
- Should you conserve minerals, or should you not remineralize?
In that case NF’s monovalent pass through becomes an asset. If a corrosive, mineral free permeate will do (and possibly is even desired), RO gets the vote.
| Application type / priority | Choose | Why |
|---|---|---|
| Water softening (keep minerals) | NF | Removes hardness, retains monovalent minerals, lower energy |
| Color / organics / sulfate removal | NF | Rejects DBP precursors and sulfate at 90–95% |
| High-TDS or brackish demineralization | RO (brackish) | >99% salt rejection above the crossover band |
| Seawater desalination | RO (seawater) | NF cannot reject monovalent salt to freshwater levels |
| Boiler feed / ultrapure water | RO (+ EDI) | Near-zero conductivity required |
| Hard, fouling feed ahead of RO | NF then RO | NF pretreatment cuts scaling and extends RO life |
| PFAS removal (drinking water) | NF | Rejects long-chain PFAS above 90% at lower pressure than RO |
| Water reuse / non-potable recycling | NF | High recovery and selective removal suit reuse duties |
| High-organic industrial effluent | NF then RO | NF strips color and organics; RO polishes to final spec |
Pay attention to the last row: NF and RO aren’t necessarily mutually exclusive. On high-organic, hard feed, NF is often installed ahead of RO to strip hardness and fouling load, which lowers RO cleaning frequency and extends membrane life. Want to run your own numbers? Our NF-vs-RO decision helper and NF grade selector take a feed profile and return a starting point.
RFQ checklist — copy these into your NF or RO quote request:
| Parameter | What to specify | Why it matters | How to verify |
|---|---|---|---|
| Feed TDS & hardness | ppm TDS, mg/L as CaCO₃ | Sets NF-vs-RO and grade | Lab water analysis |
| Target rejection | % and which ions | Avoids over-spec RO | Product-water spec |
| Test conditions | Test salt, psi, temp, recovery | Makes rejection comparable | Datasheet footnote |
| Element size | 2540 / 4040 / 8040 | Fits existing vessels | Housing dimensions |
| Fouling limits | SDI₁₅, free chlorine | Protects membrane life | Feed monitoring |
Selecting NF versus RO by duty rather than headline rejection is supported by the NIH membrane review.
How to Read Rejection Specs Without Getting Fooled
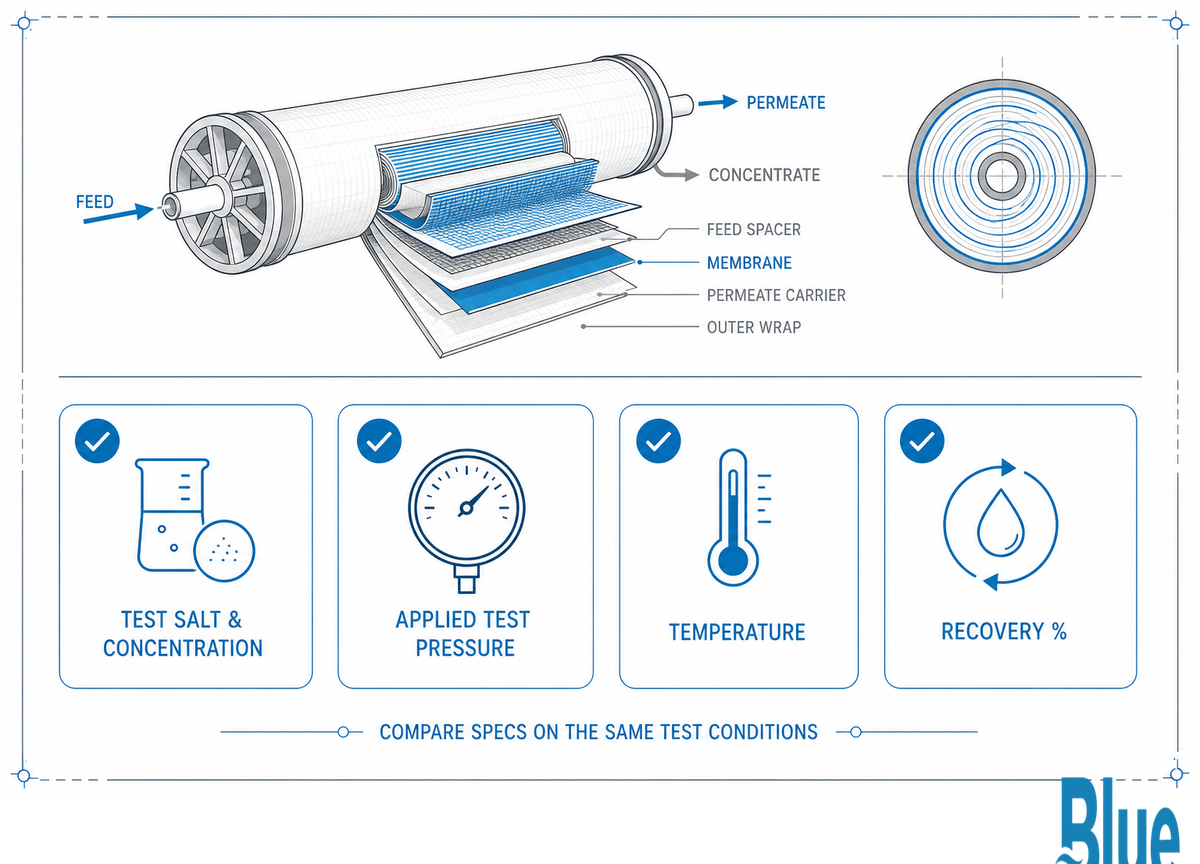
Two rejection numbers from two suppliers are rarely on the same level and that’s where the majority of buying errors are initiated. The membrane tested on magnesium sulfate (MgSO₄) at 2,000 ppm and 100 psi will demonstrate higher rejection than the identical membrane on sodium chloride (NaCl) at 150 psi-different ion, different pressure, different measurement. Rejection is a design spec not a quality measure and the same “97%” NF number as “99%” RO will very likely be talking about two very different jobs.
The Same-Ruler Rejection Check Before you rank two datasheets, normalize them. Confirm four things: the test salt (divalent MgSO₄ reads higher than monovalent NaCl), the test pressure (higher pressure inflates rejection), the temperature, and the recovery rate (rejection drops as recovery rises). Where a supplier won’t publish those four conditions, you can’t compare their number to anyone else’s – and independent research confirms that the intuitive assumption “tighter always means better” doesn’t always hold.
Here is how that plays out on a purchase. A buyer lines up a 97% nanofiltration element tested on magnesium sulfate against a 99% figure tested on sodium chloride and picks the 99% element on reflex — then watches it foul early and burn extra pressure on a softening feed it was never meant for. That higher number described a different job.
“A rejection percentage without its test condition is marketing, not a spec. If a buyer cannot reproduce the test, they cannot compare suppliers honestly.”
Senior Application Engineer, Blue Membrane
This is why real datasheets publish full test conditions.
As a reference point, our own N-series nanofiltration elements are rated at 2,000 ppm MgSO₄, 100 psi, 25 C, pH 7-8 and 15% recovery: N1 at 98.0% and N2/N3 at 97.0% stable MgSO₄ rejection, with the N3-8040 pushing up to 12,000 GPD. Those numbers only mean something because the conditions travel with them. You can see the same discipline on our nanofiltration membrane elements and industrial RO membrane elements pages.
Research confirms higher separation does not always require proportionally higher pressure, per this nanofiltration ion-selectivity study.
Industry Outlook: PFAS Rules and Water Reuse Are Redrawing the Line
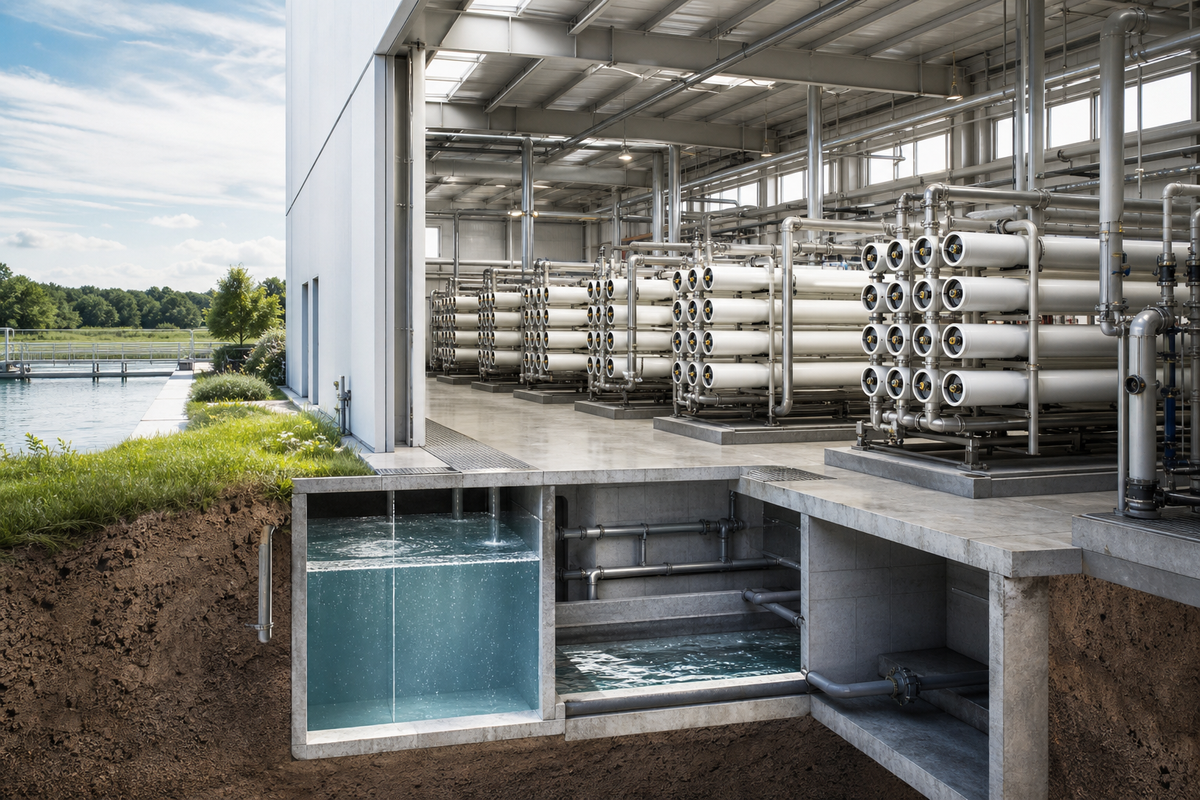
The NF-vs-RO decision is shifting because of what buyers now have to remove, not because of market size. Tightening PFAS limits are the clearest driver: as regulators push utilities and industry toward high-pressure membranes for PFAS control, nanofiltration is moving into duties once handled by RO, because it delivers strong long-chain PFAS rejection at lower energy.
At the same time, water-reuse mandates favor NF’s selective, high-recovery profile – an ACS review of NF in wastewater treatment found NF generally outperforms microfiltration and ultrafiltration and, in some cases, rivals RO for reuse duties. Rising energy costs sharpen the same trend by penalizing over-specified RO. Market context only: reverse osmosis still holds the largest share of the membrane treatment market, so this is a shift in where the NF-RO line falls, not a replacement of one by the other.
The bottom line
Choose nanofiltration when you need selective softening, color, sulfate, or long-chain PFAS removal on feed water inside the 200–1,500 ppm TDS crossover band, and you want to keep some minerals at lower energy. Choose reverse osmosis when you need near-zero TDS, high-salinity or seawater desalination, or ultrapure water — and normalize every rejection spec to the same test conditions before you compare suppliers.
Not sure which side of the line your feed water sits on?
Request an NF-vs-RO comparison for your project
Regulatory momentum on PFAS treatment technologies is tracked by the U.S. EPA.
Frequently Asked Questions
Q: What are the disadvantages of nanofiltration?
Nanofiltration rejects only 20–80% of monovalent salts, so it cannot fully desalinate high-TDS or seawater feeds; it can also foul on hard water without pretreatment and struggles with short-chain PFAS.
Its main limits are lower monovalent-salt rejection, a tendency to foul on hard feed water without proper pretreatment, and a gap on short-chain PFAS, which many membranes remove far less reliably. NF also cannot produce the near-zero-TDS permeate that boiler feed or ultrapure applications require.
For those duties you need reverse osmosis, sometimes with NF as a pretreatment stage.
Q: Is there anything better than reverse osmosis?
“Better” depends on the goal: for selective softening at lower energy and higher recovery, nanofiltration beats RO; for maximum purity, nothing consumer-grade beats reverse osmosis, often paired with EDI for ultrapure water.
If your objective is removing hardness, color, or sulfate while keeping some minerals, nanofiltration does it at roughly half the pressure and higher recovery, which makes it “better” on cost and mineral retention.
If your objective is near-total demineralization, RO – often paired with EDI or mixed-bed deionization for ultrapure water – remains the benchmark. There is no single winner; there is a right tool for each duty.
Q: What is a major downside of reverse osmosis water?
RO strips beneficial minerals like calcium and magnesium along with contaminants, leaving an aggressive low-mineral permeate, and it runs at higher pressure, higher energy, and lower recovery (50–75%) than nanofiltration.
RO typically has nearly all dissolved solids removed, so the permeate is virtually devoid of minerals and can be very aggressive. It is usually desirable to send permeate from an RO unit to a calcite or remineralization bed. It operates at pressures of 300-1,200 psi and has only 50-75% recovery, meaning it uses more energy and has more water sent to drain compared to an NF system with the same softening load.
Q: Does nanofiltration remove salt?
Partly — nanofiltration removes 90–98% of divalent salts such as calcium and magnesium sulfate, but only 20–80% of monovalent salt like sodium chloride, so it softens rather than desalinates.
That behavior is why NF is chosen to soften water and not for desalination. If you need to remove all salts, choose RO.
Q: What TDS range suits nanofiltration vs reverse osmosis?
As a rule of thumb, nanofiltration is often the economical choice for feed TDS around 200–1,500 ppm where hardness and organics matter more than demineralization; above that band, or for near-mineral-free permeate, reverse osmosis is usually warranted.
The NF system operates at a lower pressure with higher recovery, and for TDS below 1,500 ppm in what’s termed the TDS Crossover Band – where hardness and organics removal are primary concerns and full demineralization isn’t required – it usually offers a lower cost. Beyond roughly 1,500 ppm, or whenever near-mineral-free permeate is required, the additional pressure from RO is usually well worth the investment. A simple rule of thumb for TDS, but the real determining factor is the list of ions to remove and what permeate quality you are aiming for.
Q: How long do NF and RO membranes last?
Spiral-wound NF and RO elements typically last 3–7 years, with service life driven far more by feed-water quality, pretreatment, operating conditions, and cleaning discipline than by whether the element is nanofiltration or reverse osmosis.
RO and NF elements have roughly the same service lifespan, with actual duration largely dictated by pretreatment water quality, fouling rate and how vigilantly you perform cleanings. Rather than replace elements at scheduled intervals, track permeate conductivity for each vessel and schedule cleaning as needed. This is a far more influential cost driver than the type of element.
Q: Can I put an NF element in my RO housing?
Usually yes — nanofiltration and reverse osmosis elements share the standard 2540, 4040, and 8040 spiral-wound sizes and drop into the same pressure vessels, provided the housing meets the pressure rating for your chosen membrane.
RO membranes and NF membranes typically fit the same size housing, and so a membrane module for NF can often replace an RO membrane in the same vessel without re-plumbing. Double check that your current housing dimensions are compatible and that the housing has the necessary pressure rating for NF operation (it’s generally less than what you’d need for RO), then use a vessel and element matched for that configuration rather than mixing element types within a single housing.
About This Comparison
Blue Membrane is the manufacturer of all its own NF and RO membrane sheets (which it cast on a polyamide membrane casting line) and we published our actual testing results for every element, so the N-series rejection figures and UF/NF/RO ranges in this guide come from our own in-house datasheets and were verified against peer reviewed studies and standard documentation. We’d much rather recommend the less expensive sale of an NF unit than oversell RO as the solution to a softening need. By Blue Membrane technical team.
References & Sources
- Ultrafiltration, Nanofiltration and Reverse Osmosis Fact SheetSafe Drinking Water Foundation
- A Review on Reverse Osmosis and Nanofiltration Membranes for Water PurificationPMC / National Institutes of Health
- Reducing PFAS in Drinking Water with Treatment TechnologiesU.S. Environmental Protection Agency
- Nanofiltration Membranes in Wastewater Treatment: Performance ReviewACS Sustainable Resource Management
- 21 CFR 177.2550, Reverse osmosis membranes (food-contact)U.S. Electronic Code of Federal Regulations