Get in touch with Blue Membrane Company

(Updated September 2026)
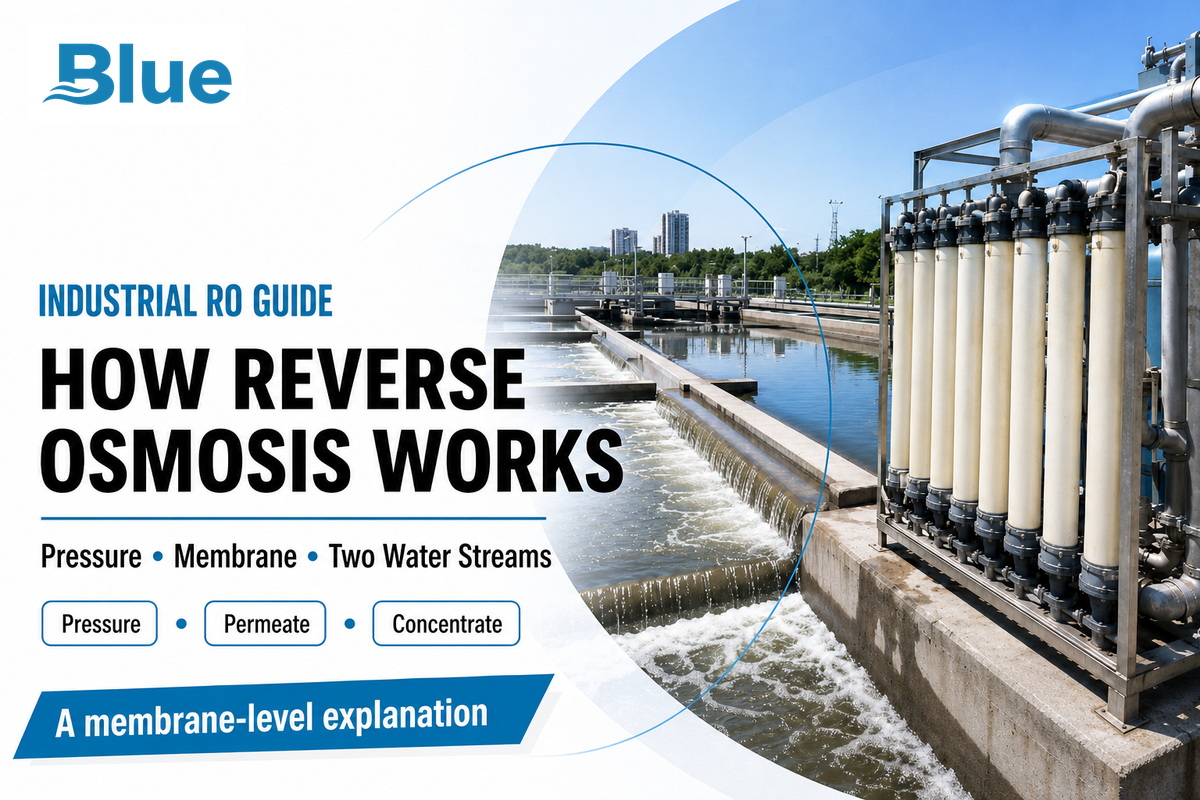
How does reverse osmosis work? Reverse osmosis is a water treatment process that forces water molecules across a selective membrane, separating a pressurized feed into lower-solute permeate and concentrate. However, that short explanation leaves out the operating conditions on which production, rejection, and membrane life depend.
Reverse osmosis uses hydraulic pressure to move water across a selective membrane against the feed’s osmotic tendency. The RO system continuously separates feedwater into permeate and concentrate; pressure, salinity, temperature, recovery, and membrane condition decide the result.
What matters most
- The membrane is selective, but it is not accurately described as an ordinary screen with one universal pore-size cutoff.
- Applied pressure is only part of the driving-force story; osmotic pressure and hydraulic losses reduce the net force available for permeation.
- Feed flow splits into two streams. Permeate is the product stream, and concentrate carries most retained material onward.
- Removal percentages are substance-specific and test-condition-specific, so “removes everything” is not a defensible claim.
- Pretreatment, recovery, crossflow, and cleaning strategy affect output and membrane life as much as the membrane label does.
How Does Reverse Osmosis Work in Five Steps?
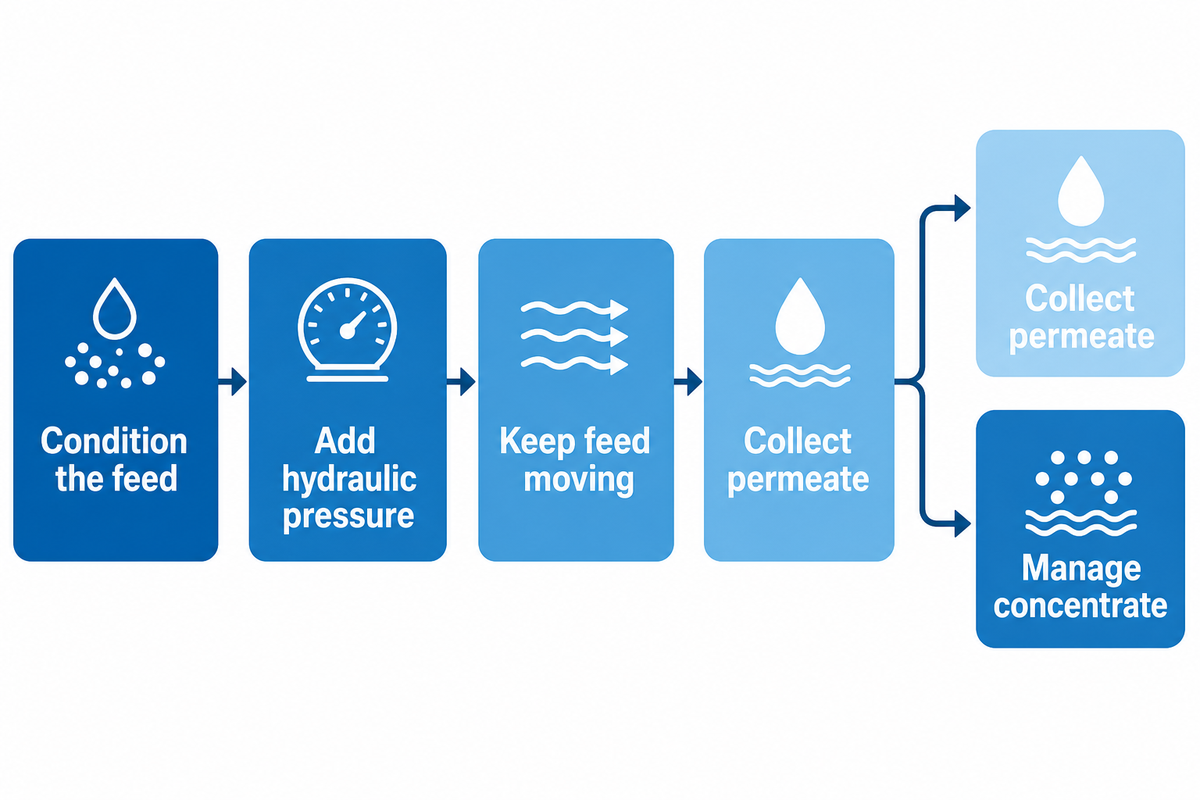
Reverse osmosis consists of conditioning the feed when needed, applying pressure, moving water across a selective membrane, collecting permeate, and removing concentrate. These steps focus more on process functionality rather than equipment. The reverse osmosis process is pressure-driven separation, not a universal reverse osmosis filtration system. A reverse osmosis filtration process may include pretreatment and post-treatment; membrane separation is central to reverse osmosis technology. The surrounding hardware will look different on a seawater plant, industrial skid, or a point-of-use unit.
1. Condition the feed
Sediment control, carbon treatment, softening, antiscalant dosing, pH adjustment, or other pretreatment may be used after the source water is tested.
2. Add hydraulic pressure
A pump or line pressure raises the feed-side pressure above the concentration-related osmotic tendency and system losses.
3. Keep feed moving across the membrane
Crossflow supplies water to the membrane surface and helps carry retained material toward the concentrate outlet.
4. Collect permeate
Water that crosses the membrane enters the permeate channel and is routed to storage, another treatment step, or its point of use.
5. Manage concentrate
The remaining stream carries a higher concentration of retained species and must be discharged, recycled, or treated within site limits.
People often mistakenly refer to every surrounding cartridge as an “RO filter,” although a sediment filter protects downstream equipment from particles. Sediment filtration removes particles before the membrane. An activated carbon filter reduces the chlorine, taste and odor, and some organic compounds. The RO membrane performs the pressure-driven separation of dissolved solutes. Post-treatment may be used to modify taste and pH, or to adjust the final water chemistry. If any of these steps is removed, that doesn’t mean reverse osmosis is removed as well.
For a home system, feed may come from municipal water or private well water, and product may go to a storage tank. Industrial water treatment may add various other pressure vessels, staged arrays, instrumentation, clean-in-place equipment, and a concentrate-recovery decision. The explanation by the U.S. EPA of point-of-use units is a useful model, but isn’t a complete description of every system.
5-Stage Pressure-to-Product-Water Flow Map
Feed conditioning → pressure → membrane crossflow → permeate collection + concentrate management.
What Is the Difference Between Osmosis and Reverse Osmosis?
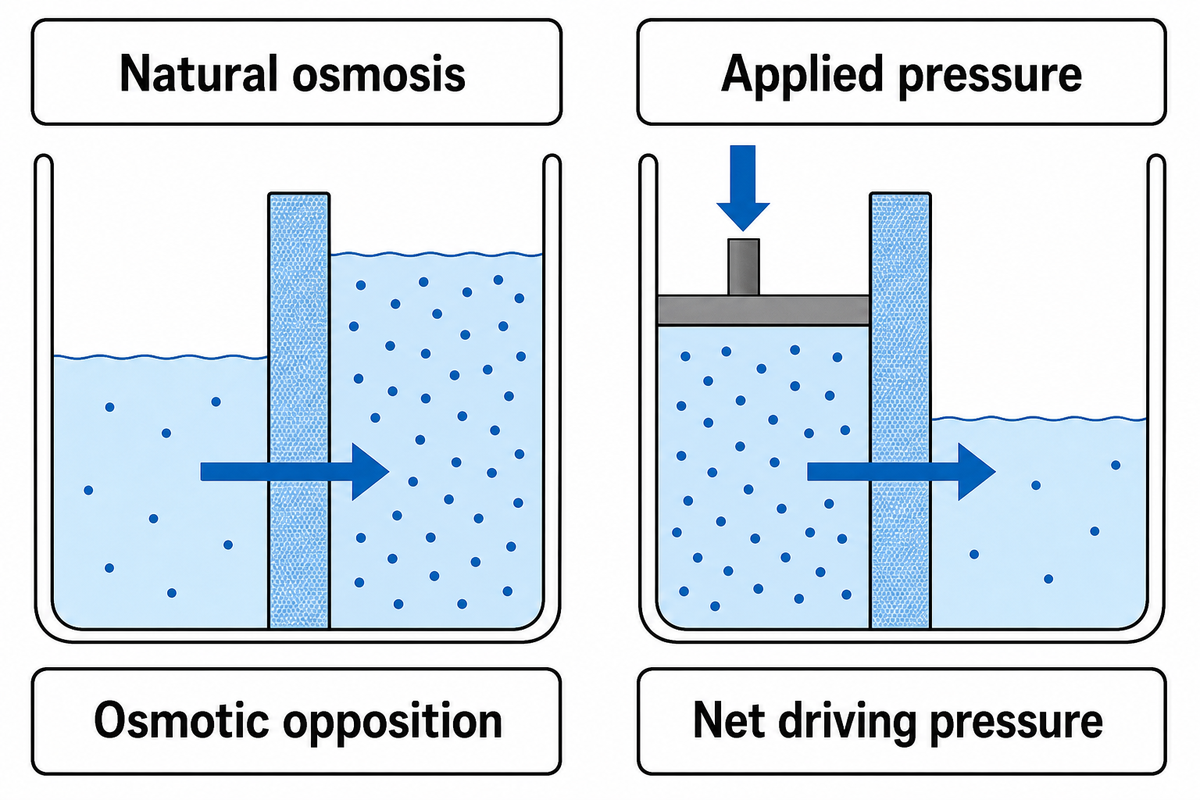
Osmosis describes the net movement of water across a semipermeable membrane in response to the difference in concentration. Reverse Osmosis (RO) forces water to move in the opposite direction by applying pressure to the concentrated side. This comparison focuses on the driving force and the net direction of movement of water and doesn’t concern a membrane that flips or changes its identity.
Consider two solutions separated by a water-selective barrier. In natural osmosis, water tends to move toward the side with more dissolved substances as chemical potentials approach equilibrium. The pressure that would stop that net movement is called osmotic pressure. At system scale, applied pressure forces water through a semi-permeable membrane to separate water from many dissolved species, but the net direction of water through a semi-permeable membrane depends on pressure after osmotic opposition. The molecular path of water molecules through the membrane remains a research question, not a universal pore-size rule. To reverse that tendency, an RO system must also overcome pressure losses in the feed channel, piping, valves, and membrane element.
“More pump pressure” isn’t the complete response. What matters is net driving pressure: the applied pressure difference minus the opposing osmotic-pressure difference and other losses. Different flows can occur with the same gauge-pressure reading if any of the following change: salinity, temperature, recovery, or hydraulic condition. The pressure and osmosis relationship is explained simply by University of Nevada Extension in their publications.
“A point-of-use reverse osmosis (RO) system is a water filtration device that is connected to a single fixture.”
The quote marks a system boundary. A domestic system that provides treated water for drinking and cooking isn’t the same as an industrial system that provides treated water for industrial processes. Both systems use RO technology; however, their pretreatment, monitoring, recovery, and concentrate handling are different.
A Typical RO Treatment Path Around the Membrane
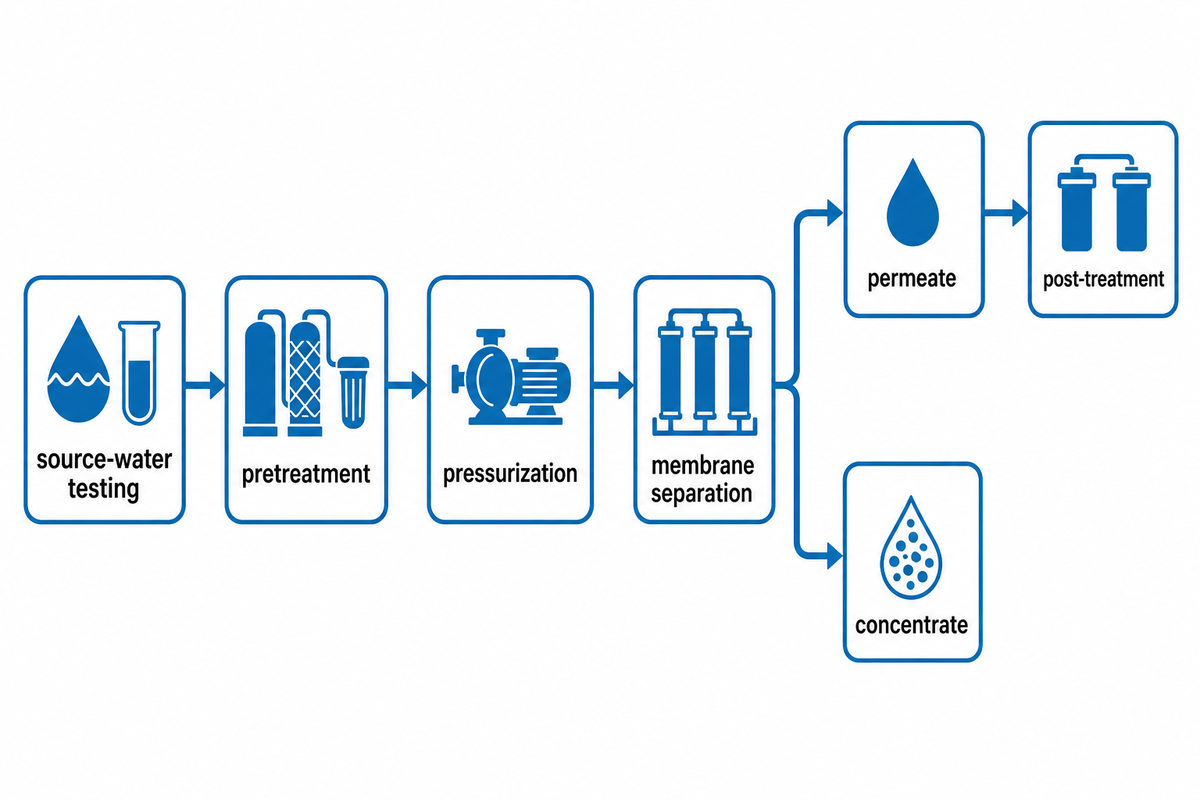
A practical RO train surrounds the membrane with equipment chosen for its measured feed and target product quality. The process can integrate source-water testing, pretreatment, pressurization, membrane separation, permeate and concentrate handling, and post-treatment. Here, “typical” is important: there’s no standard, five-cartridge sequence for tap water, hard water, seawater, or industrial wastewater.
Start with feedwater. Not a catalog. Turbidity and suspended solids suggest particle control. Free chlorine may damage some polyamide membranes and can call for carbon or chemical dechlorination. Hardness and elevated recovery pose a risk of scaling. Biological activity, colloids, iron, manganese, silica, and organic compounds all affect the pretreatment decision. Feedwater testing identifies which conditions the filter train must defend against.
After pressurization, feedwater travels in a tangential flow across the membrane surface. Some water permeates, while the remaining feed flows downstream as concentrate. Spiral-wound elements collect permeate inward through a collection layer, while feed and concentrate flow along the feed spacer. The elements can be arrayed in a configuration in which concentrate from one of the elements is used to feed another, but the acceptable staging depends on the permeate flux, recovery, pressure drop, and concentrate chemistry.
Permeate can be treated by a carbon filter, remineralization, UV, polishing, degassing, or adjusting the pH. When faucet demand peaks, a drinking water system often draws on stored RO water because permeate production is slower. Treated water for high-purity applications may use a second pass or ion-exchange polishing. The FDA technical guide shows a process topology but should be read within its inspection and pharmaceutical context.
Imagine a well-water installation that has sediment and hardness, but no free chlorine. For this feed, a carbon stage wouldn’t address hardness, while the RO membrane could remain exposed to scaling risk. The correct train begins with the measured feed and the product-water specification. Those two factors guide the pretreatment and membrane projection before any equipment order.
Does an RO Membrane Work Like a Microscopic Sieve?
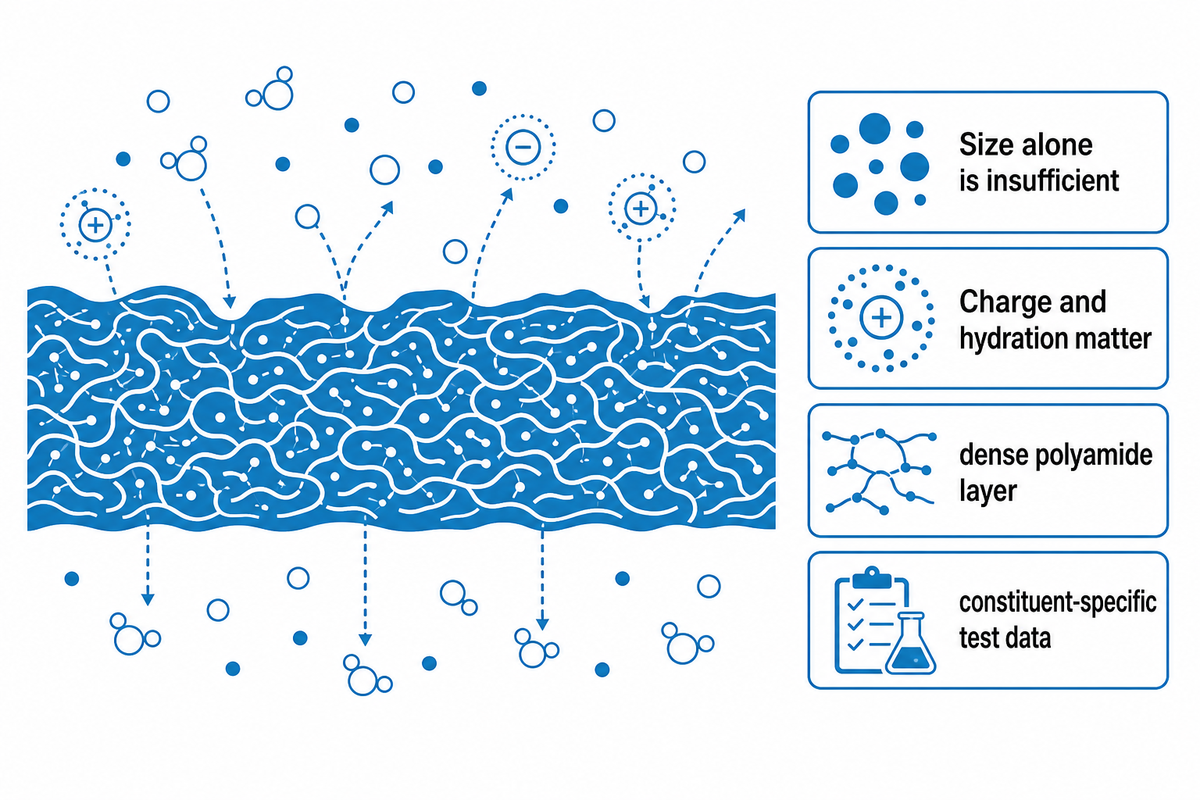
An RO membrane shouldn’t be conceived merely as a sieve with a specified hole size. Water and solutes engage with a dense polyamide selective layer at a molecular scale. Although solution-diffusion remains influential, newer pore-flow and solution-friction studies have reopened parts of the transport mechanism for debate. The scientific description is dynamic and not complete.
The sieve model may simplify the rejection process. A contaminant that’s larger than a water molecule may be retained, but size alone doesn’t determine whether small solutes pass through. However, charge, hydration, diffusivity, solubility, membrane chemistry, and operating conditions may all affect rejection. Compared with a hydrated ion, a neutral dissolved gas can behave differently. Two compounds of approximately the same apparent size may not show the same rejection. Therefore, a single micron rating cannot predict all aspects of a given RO membrane’s performance.
In 2023, a study published in Science Advances argued that the transport of solvent through transiently connected sub-nanometer pathways is better explained by pressure gradient through these pathways. In 2025, published in Frontiers, the importance of the solution-diffusion model was discussed and the incomplete understanding of the transport of water and solutes was explained. NIST has also carried out work on how water diffusion behaves under different controlled polyamide crosslink densities.
At the buyer-level, the conclusion is simpler than the scientific disputes. Never base your choice on a stated pore size of a reverse osmosis membrane. Pay attention to the published values of the membrane model for rejection, permeate flow, feed limitations, test conditions, and chemical tolerance, and examine how the membrane model was normalized. Molecular theory informs membrane design, while the datasheet and actual feed together govern the operating decision.
Common mistake
“Water is smaller, so it passes” is a teaching analogy, not a sufficient specification method. Treat it as an entry point, then check constituent-specific test data.
How Do Feed, Permeate, and Concentrate Balance?
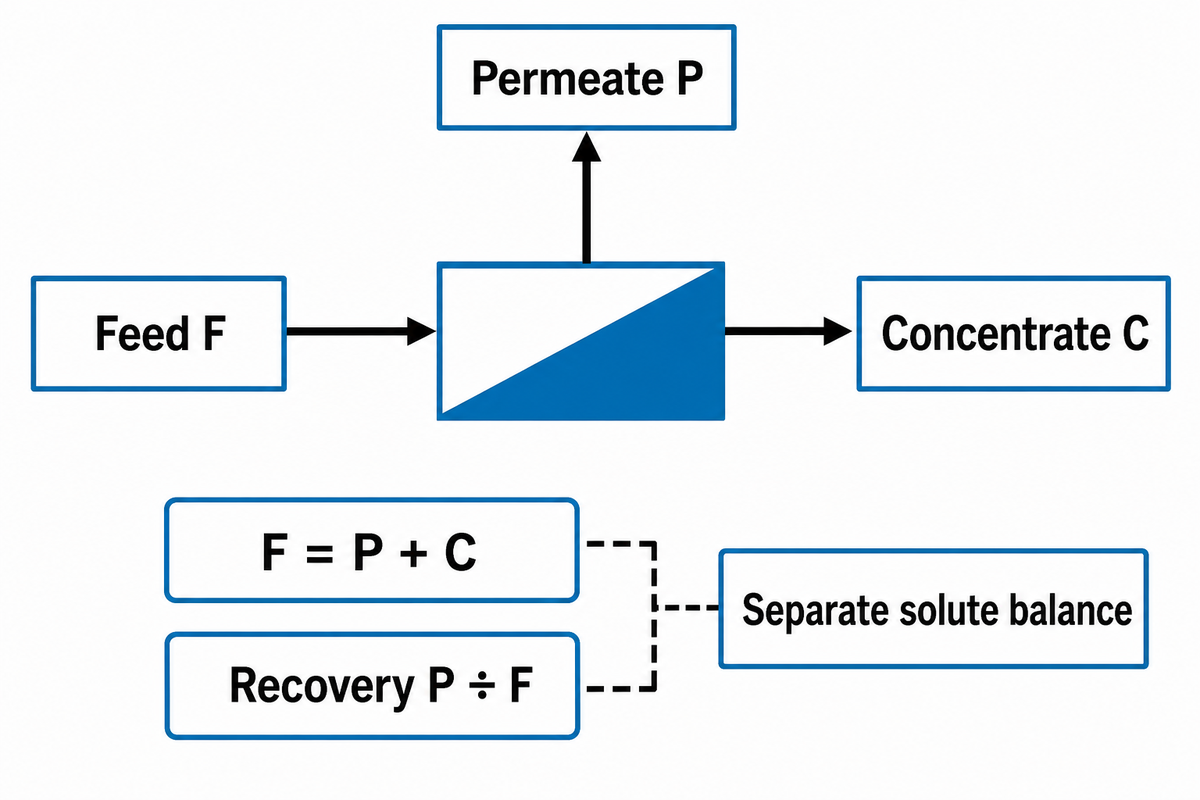
Every steady RO stage contains three stream roles: feed enters, permeate crosses the membrane, and concentrate exits with most retained material. For these streams, the total-flow balance is F = P + C. Recovery is P ÷ F. These relationships pertain to water quantity, but to account for each contaminant or salt, a separate balance is required.
3-Stream RO Balance
Feed flow equals permeate flow plus concentrate flow. Solute concentration must be checked with its own mass balance.
Take a 100-unit feed at 75% recovery. Permeate is 100 × 0.75 = 75 units. Concentrate is 100 − 75 = 25 units. This arithmetic says nothing by itself about salt passage. If the feed contains a known mass of a dissolved species, that mass must be distributed between permeate and concentrate using measured concentrations and flows.
Illustrative component balance, not a design recommendation
Assume feed flow is 100 m³/h at 1,000 mg/L of a tracked salt, 25°C, and 15 bar. At 75% recovery, permeate flow is 75 m³/h and concentrate flow is 25 m³/h. If permeate measures 20 mg/L, feed carries 100 kg/h of salt and permeate carries 1.5 kg/h. The concentrate then carries 98.5 kg/h, or about 3,940 mg/L. A second test at 10°C or a feed of 2,000 mg/L would require a new projection because viscosity and osmotic pressure changed.
Calculation audit trail: the baseline inputs are 100 m³/h, 1,000 mg/L, 25°C, 15 bar, and 75% recovery. The calculated stream values are 75 m³/h permeate and 25 m³/h concentrate, with a measured 20 mg/L permeate. The component balance is 100 kg/h in, 1.5 kg/h through the membrane, and 98.5 kg/h in concentrate, which equals about 3,940 mg/L. Changing the test vector to 10°C or 2,000 mg/L requires a fresh calculation rather than copying the baseline result.
Considering all concentrate as “water waste” may seem to answer the design question. Operators sometimes call concentrate reject water, but that label alone does not specify recovery. A point-of-use unit may send gallons of water to drain over time, whereas an industrial buyer should measure the amount of water in each stream against demand and discharge limits. In a point-of-use unit, concentrate normally goes to drain. An industrial site may evaluate reuse, cascading, evaporation, further recovery, or compliant discharge. Higher recovery reduces concentrate volume per unit of feed, but retained species become more concentrated near and downstream of the membrane; a designer must therefore check the scaling potential of the actual concentrate, the flow available for crossflow, pressure drop across the elements, and the permitted outlet rather than choosing recovery solely to minimize the drain stream. Scaling and fouling limits can tighten before the pump or membrane reaches its nominal capacity.
The EPA makes a clear differentiation between concentrate and permeate for point of use systems. In industrial systems, the same stream names are used, but recovery should be outlined for each element, vessel, stage, and system. Without those boundaries, a recovery percentage can mislead a client.
| Evidence type | Question | Why it changes the decision |
|---|---|---|
| 1. Boundary type | Element, vessel, stage, or plant? | Recovery differs by boundary. |
| 2. Feed-flow type | Instantaneous or daily average? | Intermittent operation changes totals. |
| 3. Permeate-flow type | Normalized or observed? | Temperature and pressure affect observation. |
| 4. Concentrate-flow type | Measured or inferred? | Leaks and recycle can break a simple inference. |
| 5. Recovery type | P ÷ F at which scope? | High system recovery can coexist with low element recovery. |
| 6. Recycle type | Is any stream returned? | Internal and external flows no longer match. |
| 7. Solute-balance type | Are concentration and flow both measured? | Flow balance cannot prove rejection. |
| 8. Stabilization type | Was the reading taken at steady state? | Startup readings can misstate production. |
| 9. Disposal type | Where does concentrate go? | The outlet can constrain the feasible recovery. |
What Does Reverse Osmosis Remove, and What Are Its Limits?
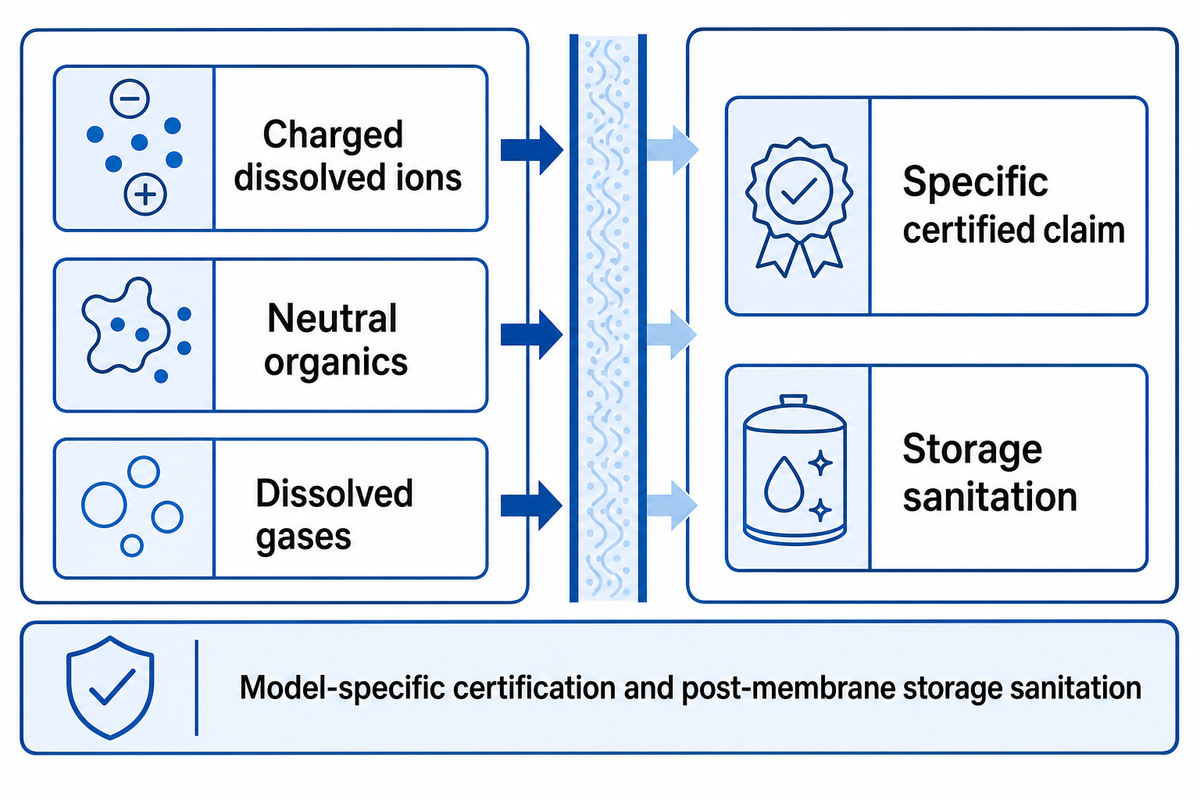
While reducing many dissolved salts, reverse osmosis won’t remove all contaminants. Rejection is substance dependent and relies on the membrane, feed, pressure, temperature, recovery, pretreatment, and membrane condition. Instead of quoting a generic percentage for some unspecified contaminant, drinking-water claims should cite the specific constituent and tested standard.
Although it isn’t a complete analysis, reverse osmosis is an effective tool against most charged, dissolved ions. With many charged dissolved ions showing high rejection under suitable conditions, total dissolved solids is a common system-performance indicator. However, total dissolved solids describes a bulk dissolved-solute concentration; electrical conductivity can be used to estimate TDS with a composition-dependent conversion, not treated as the same measurement. Some neutral organics and dissolved gases may behave differently. Microbial control relies on system integrity, storage sanitation, and prevention of post-membrane contamination, not on membrane material alone.
The current NSF/ANSI 58 overview separates required material, design, and TDS-reduction provisions from optional reduction claims for individual contaminants. This distinction is meaningful when considering the best reverse osmosis systems for a home, as the scope and rigor of the certifications are of greater importance than an extensive and unqualified list of potential water contaminants. The benefits of reverse osmosis are constituent-specific: reducing contaminants from water can improve water quality, but drinking water quality must be checked for the actual feed, certified claim, storage, and maintenance. The quality of your drinking water cannot be inferred from generic promises of pure water or water purity without a measured, model-specific result.
A carbon filter and an RO membrane solve different aspects of water purification. While activated carbon and RO membranes respectively control taste and odor and remove dissolved-solutes, a complete water filtration process can use both. The presence of multiple filters doesn’t make every stage interchangeable.
When a local municipal report mentions a substance in a specific way, household consumers may look to improve the quality of drinking water. Thinking of spending money to purchase a system with a claim of “up to 99% removal” may skip an important step. Buyers should match the substance to a certified, substance-specific claim, then confirm feed limits and maintenance requirements. If the problem is with private well water, test your water first, since the source profile can change with the season.
Decision rule
A removal claim is usable only when it names the contaminant, membrane or system, test method, feed condition, and reduction result.
Which Variables Change Real RO Performance?
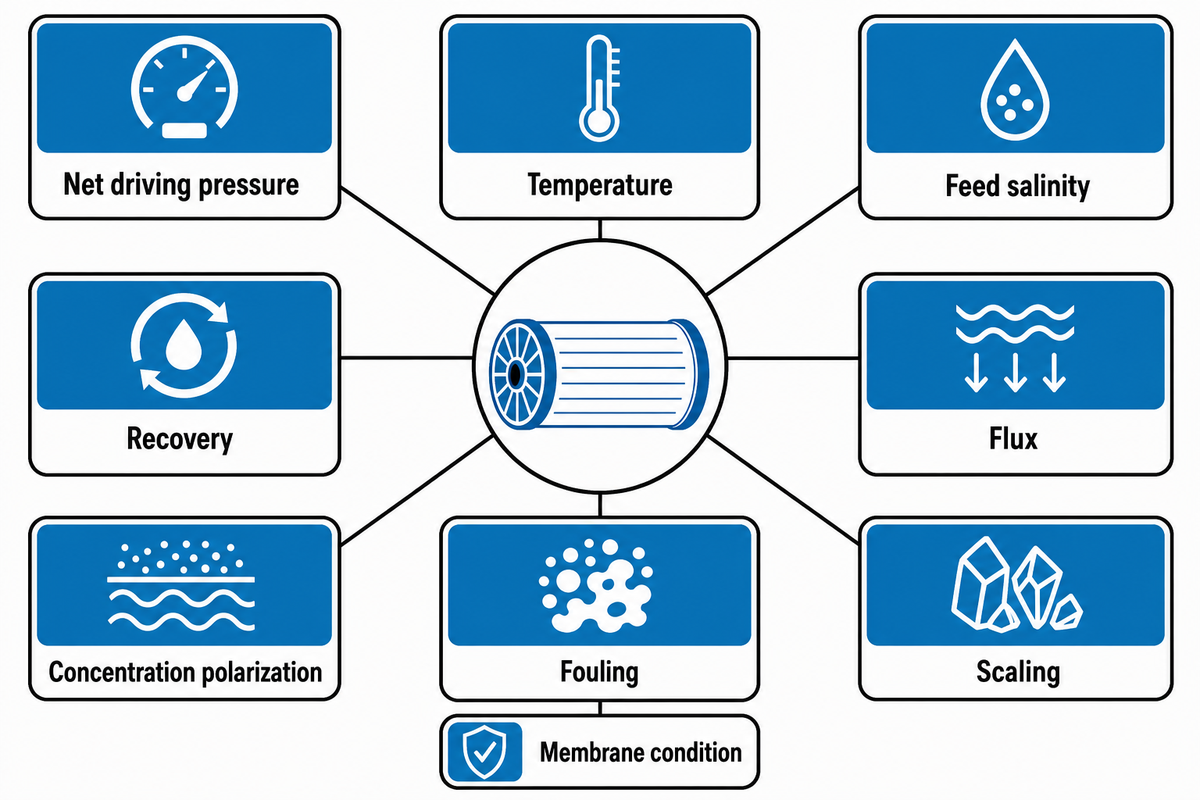
RO performance is impacted by net driving pressure, temperature, salinity, recovery, concentration polarization, fouling, scaling, pressure loss, and membrane condition; falling permeate flow may reflect colder feed, rising surface concentration, or a blocked spacer, so operators need context before blaming the membrane. Operators therefore compare normalized trends rather than one raw permeate-flow reading. Lower flow may reflect cold feedwater, higher osmotic pressure, surface deposition, hydraulic losses, or several factors at once.
Concentration polarization is easy to miss. DuPont’s 2026 FilmTec technical manual defines it as a rise in solute concentration in a thin feed-side boundary layer at the membrane surface, rather than a change in the bulk-feed sample. As solute accumulates at the membrane surface, the local concentration can exceed the value in the bulk feed. This will increase the local osmotic resistance and can promote scaling. Factors affecting the boundary layer include crossflow, feed spacer geometry, flux, recovery, and viscosity. The process water may appear unchanged at the feed sample point while the membrane sees a local environment that’s harsher. For high-purity water applications, the water purification process may need polishing after RO; a raw permeate conductivity reading alone does not establish the required grade. This is also why membrane flux and local chemistry matter more than a broad claim about water through the membrane.
Water viscosity is temperature sensitive. So is membrane transport. Increased salinity will increase osmotic pressure. Increased applied pressure will increase permeate flow within the limits of the membrane and system, but won’t remove fouling or explain a decreasing normalized flow. Feed-channel pressure drop is an additional diagnostic signal. Blue Membrane’s membrane-in-reverse-osmosis article covers these operating variables more extensively.
| Variable | Direct effect | Buyer or operator check |
|---|---|---|
| Net driving pressure | Changes water transport force | Compare feed, permeate, concentrate pressure and osmotic terms. |
| Temperature | Changes viscosity and permeation | Normalize before comparing days. |
| Feed salinity | Changes osmotic pressure | Use current feed analysis. |
| Recovery | Concentrates retained species | Check element, stage, and system scope. |
| Flux | Changes surface loading | Compare to model guidance for the feed type. |
| Concentration polarization | Raises membrane-surface concentration | Review crossflow and spacer condition. |
| Fouling | Adds transport resistance | Trend normalized flow and pressure drop. |
| Scaling | Deposits sparingly soluble salts | Model concentrate chemistry at target recovery. |
| Membrane condition | Changes passage and productivity | Check age, cleaning history, oxidation exposure, and integrity. |
One common objection to specifications is “why not specify the highest published flow?” The published flow is associated with the specifically mentioned test feed and test conditions. A lower-flux choice may offer better fouling tolerance or a safer operating window with more challenging source water. Laboratory flow shouldn’t be treated as plant output until the system has been designed for its feed and operating conditions.
How Do Pretreatment and Fouling-Resistant Membranes Fit?
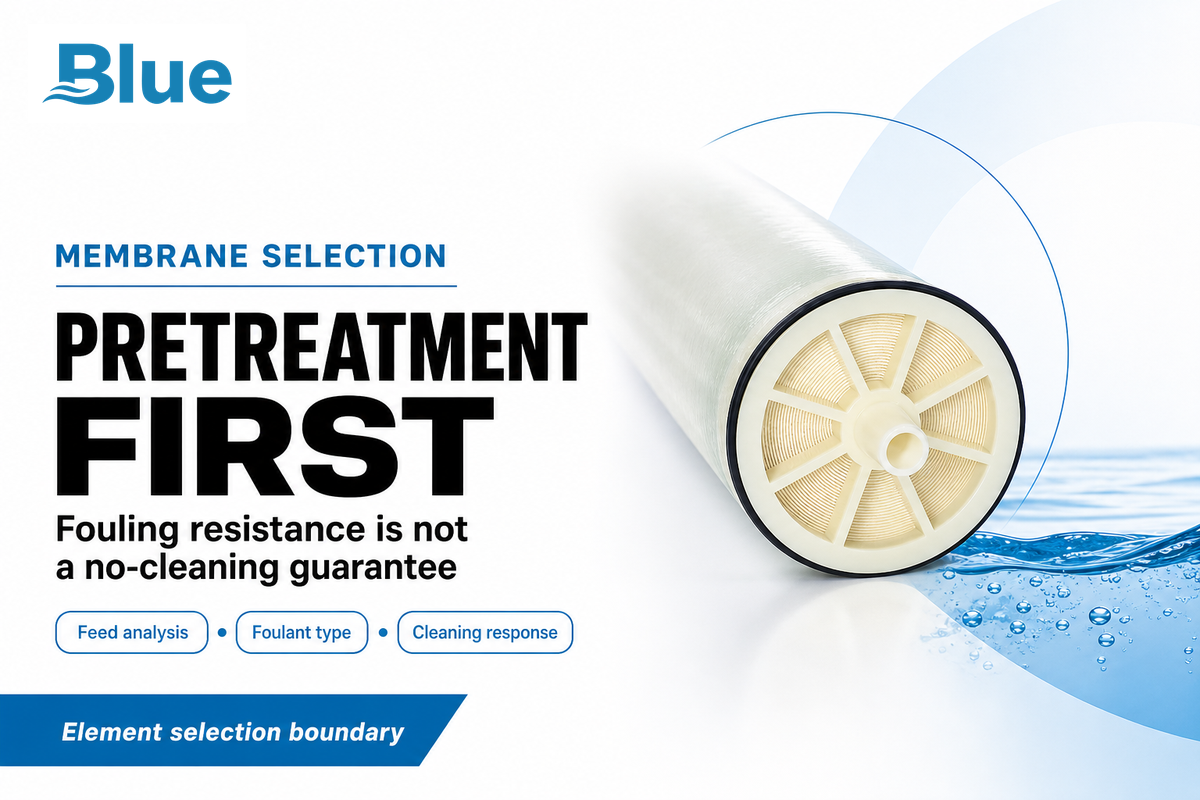
The purpose of pretreatment is to control feed conditions which can foul, scale, oxidize, or cause physical damage to an RO membrane. A fouling resistant element can change the surface properties and operating tolerance, but won’t eliminate the need for feed analysis, crossflow, cleaning and control of the concentrate. Selection should follow the foulant mechanism rather than a product label alone.
Particulate fouling, organic adsorption, biological growth, and mineral scale don’t have a single remedy. Sediment filtration helps with suspended matter. Carbon or chemical reduction may protect chlorine-sensitive polyamide. Specific scaling risks can be addressed by softening, acid adjustment or antiscalant. Biological control and cleanability become important once nutrients and microorganisms reach the membrane train.
According to Blue Membrane, the fouling-resistant ro membrane elements are appropriate for challenging feedwater and may slow deposition although system cleaning will still be required. This is a proper statement for a first-party claim in this context. A customer still needs feed analysis, target recovery, pretreatment design, membrane compatibility limits, and a cleaning plan.
From the About page of the company’s website, Blue Membrane manufactures membrane elements and integrated systems, and provides services for industrial, municipal, marine, and commercial markets in more than 20 countries. This is a first-party claim. It isn’t intended to represent an independent assessment of market share.
An industrial customer may note a drop in normalized permeate flow, and an increase in feed and differential pressure. Replacing an element with a fouling resistant model may increase the time between element replacements only if comparable normalized performance and cleaning response under the same feed substantiate that interval; however, this model doesn’t differentiate between deposits that may be colloidal, organic, bio-fouling, or even scale. Deposit analysis and cleaning response can identify the foulant and guide pretreatment correction. Without this work, a replacement of the fouling resistant model is likely to be short lived.
Procurement boundary
Ask which foulant and operating window the membrane design addresses. “Fouling resistant” is a selection input, not a no-cleaning guarantee.
How Do Residential and Industrial RO Systems Differ?
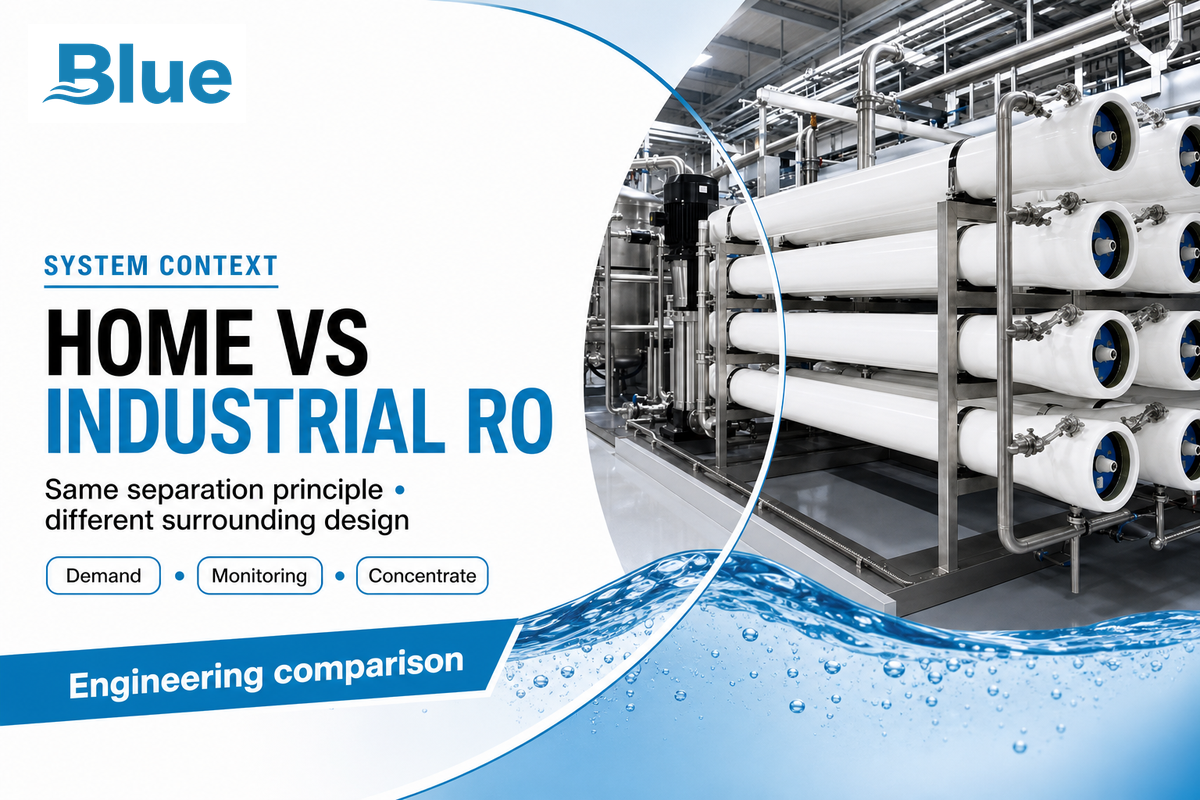
RO systems perform pressure-driven separation but need different surrounding designs for residential and industrial uses. Point-of-use RO treats a single fixture and often uses a storage tank. Industrial systems can incorporate staged pressure vessels, continuous tracking, chemical dosing, CIP, redundancy, and a formal concentrate management plan.
Demand for household water isn’t continuous and can benefit from filtered water production and storage to meet peak faucet demand. Installing a reverse osmosis system for your home starts with daily water needs, peak faucet demand, feed testing, and sustainable membrane output, not the taste of your water alone. Under-sink reverse osmosis water filter systems may need a storage tank when peak use exceeds membrane production. The feed water is generally city water, but some private well water could need different pretreatments. Routine maintenance focuses on filter changes, tank sanitation and condition, and a measured product-water quality check. The installation of a reverse osmosis unit without confirming the system pressure and feed chemistry could result in low flow or early scale.
Industrial demand can be continuous and measured by process throughput rather than the number of glasses of water used. Arrays are used to divide and control the flow across vessels and/or stages. Instruments are used to trend and/or monitor process pressure, conductivity, flow, temperature, and sometimes oxidation-reduction potential or other specific parameters of the feed. Normalized data are used to make decisions on planning and scheduling cleaning, chemical and concentrate management, and potential spare capacity. The feasibility of a recovery system is dependent on the planned route of concentrate removal and/or reuse.
For the residential side of the comparison, the EPA’s POU scope provides a useful reference for industrial buyers. Like the residential users, industrial buyers should review element limits and system design, rather than extending a countertop or under-sink efficiency claim to a multi-stage skid.
Equivalent home-market terms should not be mistaken for identical engineering water-quality grades. For your home, a reverse osmosis system may address a particular water-quality problem, but its water purification process and drinking-water claim must be checked against the actual source. Those consumer labels are not an industrial membrane projection. “reverse osmosis water,” “purified water,” “fresh water,” “clean water,” and “high-quality water” must not be treated as separate engineering grades. A reverse osmosis filter can’t guarantee the highest quality water for every water supply. The system functionality is dictated by water pressure, source water analysis, storage capacity, and service schedule. Pressure forces water through a membrane; nevertheless, the surrounding filters treat feed risks. When considering reverse osmosis drinking water and bottled water, evaluate measured composition, packaging, service, and cost, not just taste in comparison. The osmosis system in your home determines whether it can produce water fast enough based on the daily demand for water, or whether it will require a larger tank.
| Design point | Point-of-use / residential | Industrial |
|---|---|---|
| Demand | Intermittent faucet use | Scheduled or continuous process demand |
| Pressure | Line pressure or compact booster | Dedicated high-pressure pumping |
| Storage | Common | Application-specific |
| Monitoring | Basic quality and service indicators | Continuous pressure, flow, conductivity, and trend data |
| Concentrate | Usually drain-connected | Reuse, treatment, or permitted discharge decision |
How Should You Read an RO Performance Claim?
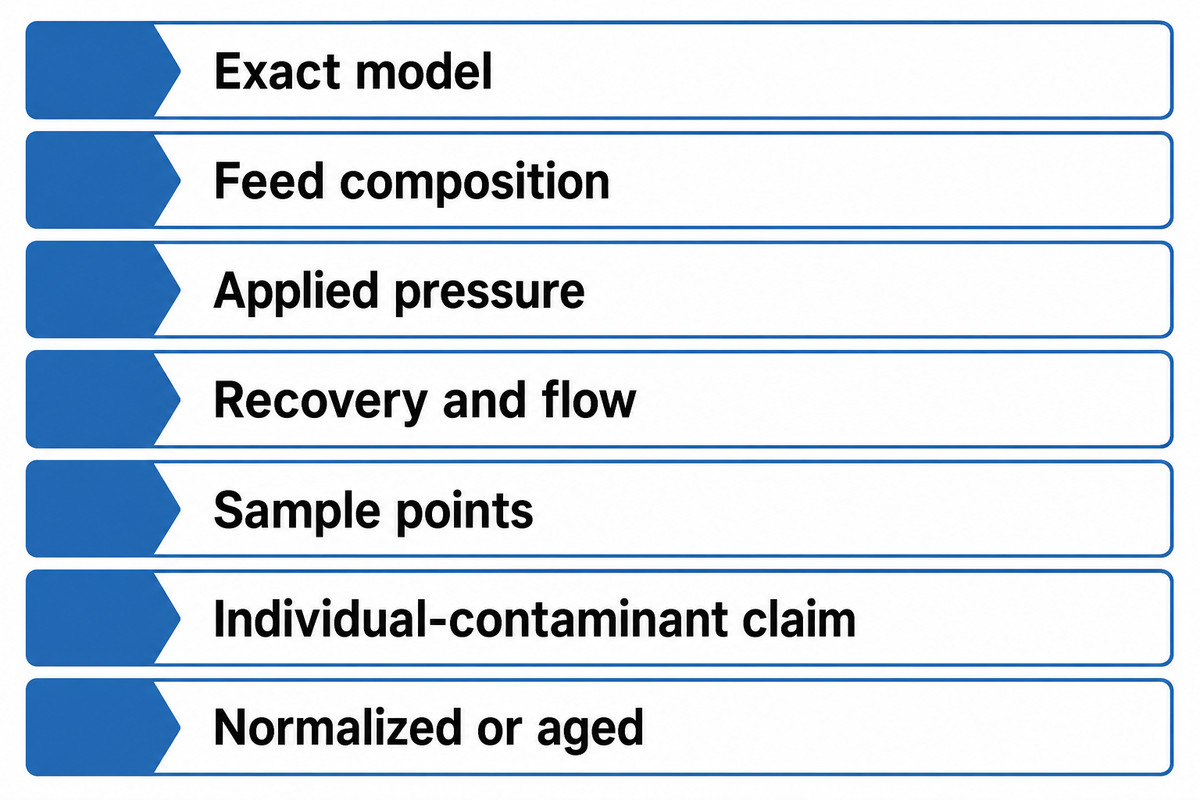
Consider the model of the RO membrane in combination with the percentage performance for the given conditions of the test feed, temperature, pressure, recovery, flow, pH, stabilization time, and measurement method. That performance percentage isn’t portable beyond the stated test conditions. It can’t reasonably predict product-water quality, operating cost, or cleaning intervals on a different feed.
Rejection is commonly expressed as [1 − (permeate concentration / feed concentration)] × 100%. The equation may be simple, but the location and timing of sampling matter. Concentration of feed may vary along the length of a pressure vessel. Permeate from one component isn’t the same as the permeate from a blended system. The rejection of conductivity doesn’t imply rejection of all the components.
Discipline is equally necessary for production claims. Temperature, net driving pressure, salinity, recovery, and membrane area affect output. A stabilized salt-solution test can’t describe cold well water or an industrial feed prone to fouling without a new projection. Published numbers are comparison inputs under matching conditions; they can’t guarantee production from any installation.
For drinking water, look for the exact certification and reduction claim on the product documentation. NSF’s NSF/ANSI 58 summary explains why required TDS-reduction testing and optional contaminant claims are not the same thing. For industrial procurement, ask for projection assumptions, design flux, element recovery, pressure drop, chemical limits, and normalized acceptance criteria. The question ‘how does this system work?’ requires test conditions and a flow balance, not a claim that all reverse osmosis solutions deliver the same product water. Reverse osmosis filtration can be one stage of a larger train, with each stage judged against the specified feed and product.
For a transferable comparison, the test record would state feed temperature of 25°C, applied pressure of 15 bar, feed concentration of 1,000 mg/L, feed flow of 100 m³/h, and recovery of 75%, while identifying each sampling location, the stabilized operating period, and whether the reported pressure refers to a pump outlet or the membrane inlet. If an instrument reads 15.2 bar but the summary rounds it to 15 bar, the record should say so. Removing any of these values would make comparison more difficult, before consideration of the sampling method and the age of the membrane.
Claim-reading checklist
- Name the exact membrane or system model.
- Record feed composition, concentration, pH, and temperature.
- Record applied pressure and the basis for net driving pressure.
- Define recovery and flow at the correct boundary.
- Identify sample points, stabilization time, and analytical method.
- Separate conductivity/TDS results from individual-contaminant claims.
- Ask whether results are initial, normalized, aged, or post-cleaning.
Elementary aspects of the ro membrane definition coexist with the reverse osmosis membrane guide, while this page concentrates on the operating principles.
Frequently Asked Questions
Why is it called reverse osmosis?
Answer
It’s called reverse osmosis because applied pressure makes the useful water flow oppose the direction associated with natural osmosis. In natural osmosis, water moves across a selective barrier toward the side with higher solute concentration. An RO system pressurizes that concentrated feed side strongly enough to create positive net driving pressure, so water crosses toward the lower-solute permeate side while much of the dissolved material remains in the concentrate stream.
Does reverse osmosis remove all contaminants?
Answer
No. Reverse osmosis can achieve high rejection for many dissolved salts and reduce numerous other constituents, but performance depends on the membrane, the specific substance, feed chemistry, pressure, temperature, recovery, pretreatment, and system condition. Some small neutral compounds and dissolved gases behave differently from common ions. A responsible claim should therefore name the tested contaminant, reduction level, standard, and operating conditions instead of promising that an RO unit removes everything.
Does reverse osmosis waste water?
Answer
An RO process produces both permeate and concentrate, so not all feedwater becomes product water in one pass. Calling the concentrate simply “waste” can be misleading in industrial systems because its volume and possible reuse or disposal depend on recovery, water chemistry, scaling limits, and local requirements. For example, a 100-unit feed at 75 percent recovery yields 75 units of permeate and 25 units of concentrate. Higher recovery isn’t automatically better if it increases fouling or scaling risk.
What is the difference between osmosis and reverse osmosis?
Answer
Osmosis is spontaneous net water movement across a selective barrier toward the higher-solute side. Reverse osmosis applies external pressure to drive useful net movement toward the lower-solute permeate side.
Why does the required RO pressure change with feedwater?
Answer
The pump must overcome osmotic pressure and hydraulic losses while leaving enough net driving pressure for useful water transport. A saltier feed generally has higher osmotic pressure. Temperature changes water viscosity and membrane transport. Recovery changes the concentration presented to later elements and stages. Concentration polarization can make the membrane-surface concentration higher than a bulk feed sample suggests. Fouling, scaling, spacer blockage, and valve or piping losses also change the operating point. For that reason, a pressure quoted for warm municipal water can’t be transferred directly to cold well water, brackish process water, or seawater. A projection should use the current feed analysis, temperature range, target recovery, element arrangement, and product-water requirement, followed by checks against the selected membrane model’s published limits.
Match the Membrane to the Feedwater
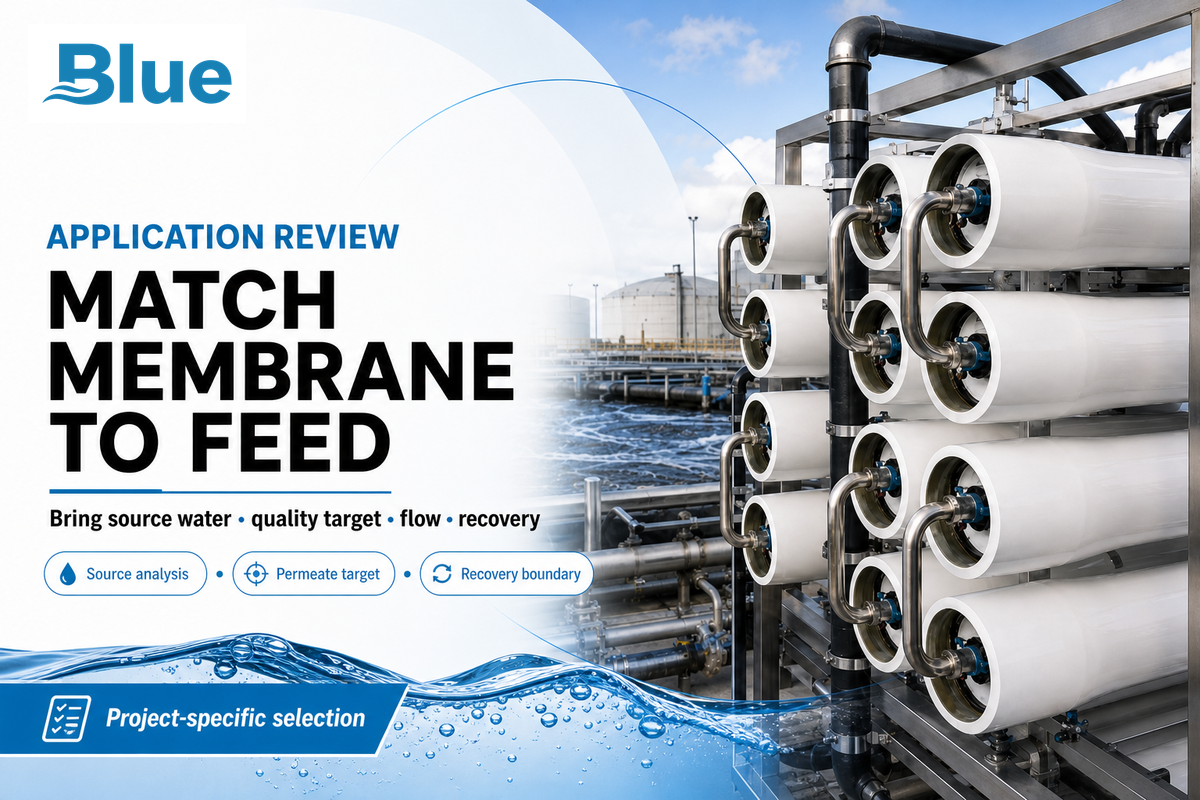
Share the source-water analysis, target permeate quality, required flow, and recovery boundary before selecting an element.
Editorial note: A project-specific answer needs feed analysis, membrane projection, and validation under its actual operating conditions.
References & Sources
- Point-of-Use Reverse Osmosis Systems, U.S. Environmental Protection Agency.
- Osmosis and Reverse Osmosis, University of Nevada Extension.
- Reverse Osmosis Inspection Technical Guide, U.S. Food and Drug Administration.
- Water transport in reverse osmosis membranes is governed by pore flow, not a solution-diffusion mechanism, Science Advances, 2023.
- Peer-reviewed membrane transport discussion, Frontiers in Membrane Science and Technology, 2025.
- Correlating diffusion of water in model polyamides with controlled crosslink densities to performance, National Institute of Standards and Technology.
- NSF/ANSI 58: Reverse Osmosis Drinking Water Treatment Systems, NSF.