Get in touch with Blue Membrane Company

Reviewed by the Blue Membrane technical team · Updated July 2026
RO Membrane — Quick Facts
~0.0001 µm
Separation threshold
Separation threshold
95–99.8%
Salt rejection range
Salt rejection range
TFC polyamide
Membrane chemistry
Membrane chemistry
4040 / 8040
Standard element sizes
Standard element sizes
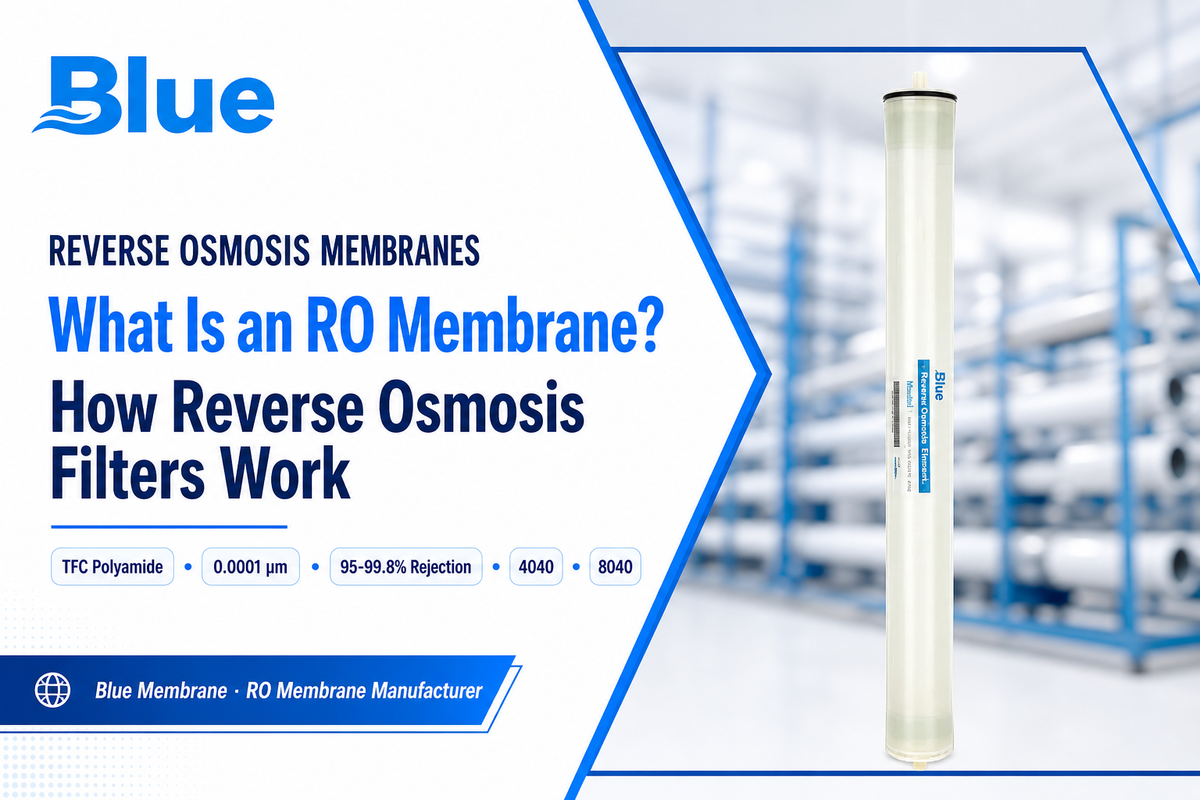
If you’ve priced replacement filters for a water system, you’ve run into the term RO membrane (reverse osmosis membrane) and probably a wall of specs that assume you already know what one is. This guide fixes that. An RO membrane is the single component that does the actual separation in a reverse osmosis system, and understanding how it works tells you why two membranes with the “same” rejection number can behave completely differently in your water.
In short: What is an RO membrane? An RO membrane is a semi-permeable, thin-film composite sheet that allows water molecules to pass while blocking dissolved salts, organics, and most contaminants down to roughly 0.0001 micron. It only works when feedwater is pushed through it under pressure that exceeds the water’s natural osmotic pressure.
Key takeaways
- A rejection percentage means nothing without its test conditions, pressure, salinity, and temperature all move the number.
- RO membranes aren’t a single product; they split into classes by feedwater (low-pressure, brackish, seawater, fouling-resistant, residential).
- The “replace every 2–3 years” rule is arbitrary. Track permeate conductivity and pressure drop instead.
- RO sits at the tight end of the membrane spectrum, finer than nanofiltration, ultrafiltration, and microfiltration.
What Is an RO Membrane?
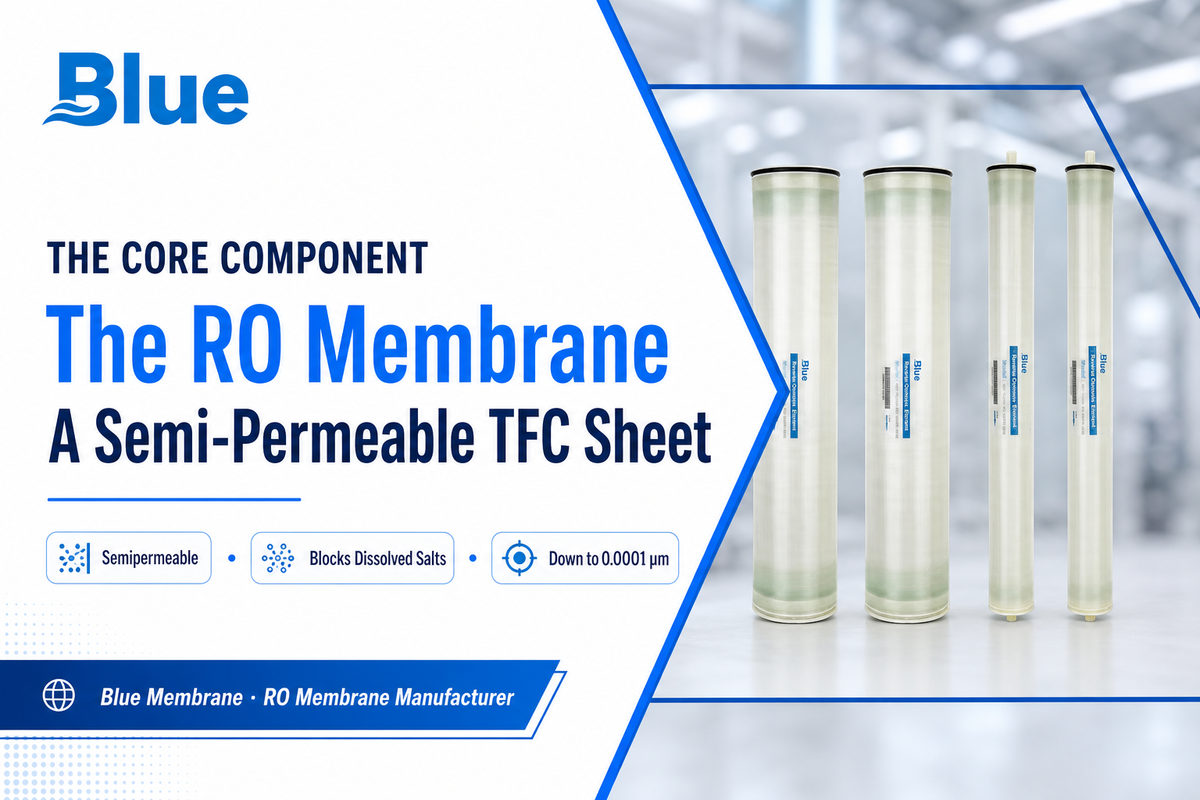
An RO membrane is the semi-permeable barrier at the heart of a reverse osmosis system. It lets water molecules pass while rejecting the great majority of dissolved salts, organic molecules, and other contaminants. The U.S. Food and Drug Administration describes the underlying process plainly: reverse osmosis “uses a membrane under pressure to separate relatively pure water from a less pure solution,” according to the FDA’s technical guide on reverse osmosis.
In everyday use, “membrane” suggests a simple screen, yet an RO membrane rejects things far smaller than any pore you could see. It removes dissolved ions, the sodium and chloride in salt, calcium and magnesium in hard water, not just suspended particles. That’s what separates it from an ordinary sediment or carbon filter, and it’s why every serious water-treatment train, from a countertop unit to an industrial RO membrane element, is built around the same basic idea. Get the choice wrong and it costs you: pick a membrane built for the wrong feedwater and it can foul or fail within weeks. Picture a plant that drops a tap-water element into a brackish well at 5,000 ppm — rejection sags, the element scales, and it is scrap long before its rated life.
How Does an RO Membrane Work?
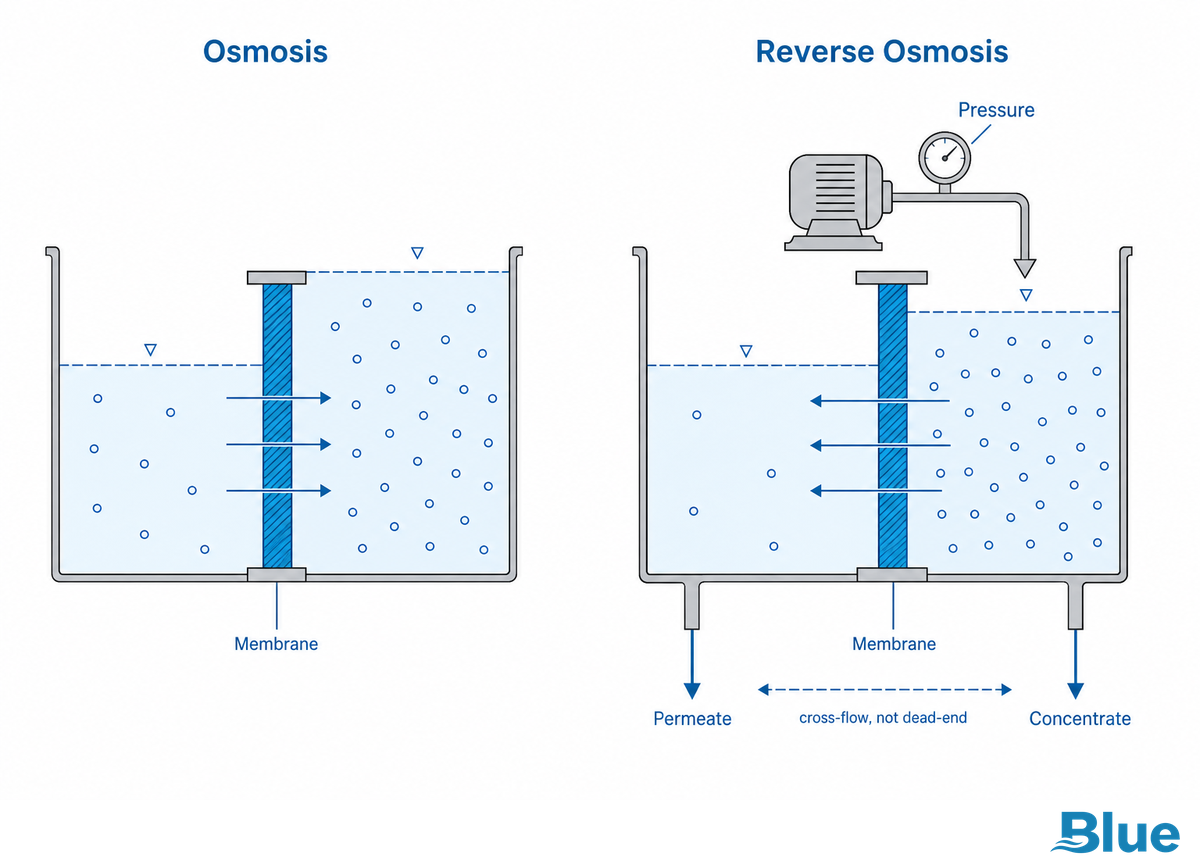
An RO membrane works by reversing osmosis. In nature, water moves across a semipermeable membrane from a weaker solution toward a stronger one, the process your plant roots and kidneys rely on. Reverse osmosis flips that: a pump applies pressure to the salty side that’s greater than the natural osmotic pressure, forcing water molecules backward through the membrane and leaving the dissolved solids behind, as the U.S. EPA’s overview of point-of-use RO systems explains.
Two streams come out. One side is clean, the permeate (product water); the leftover with the concentrated contaminants is the concentrate, reject, or brine. Crucially, RO uses cross-flow filtration, not dead-end filtration: water sweeps across the membrane surface so rejected material is carried away instead of caking on top. That’s why an RO membrane can run for years rather than clogging like a paper filter.
How is reverse osmosis different from normal osmosis?
Normal osmosis is spontaneous and needs no energy, water drifts toward the saltier side on its own. Reverse osmosis isn’t spontaneous: you have to spend energy (pump pressure) to push water the “wrong” way, against the salinity gradient. A saltier feedwater raises the osmotic pressure you must overcome, which is exactly why seawater membranes run near 800 psi while low-salinity tap water needs only 150–225 psi.
Rejection also depends on charge, not just size, a doubly charged calcium ion is held back more easily than a singly charged sodium ion, per the StatPearls overview from the National Library of Medicine.
💡 The 0.0001-Micron Rule
RO separates on the order of 0.0001 micron — roughly 0.1 nanometre, or angstrom scale. Treat that as an effective selectivity level rather than a literal sieve pore: the dense polyamide barrier of a semipermeable membrane transports water and rejects ions by solution-diffusion, not by straining them through holes. Remember that one number and the rest of the membrane world falls into place: everything coarser is nanofiltration, ultrafiltration, or microfiltration.
What Is an RO Membrane Made Of?
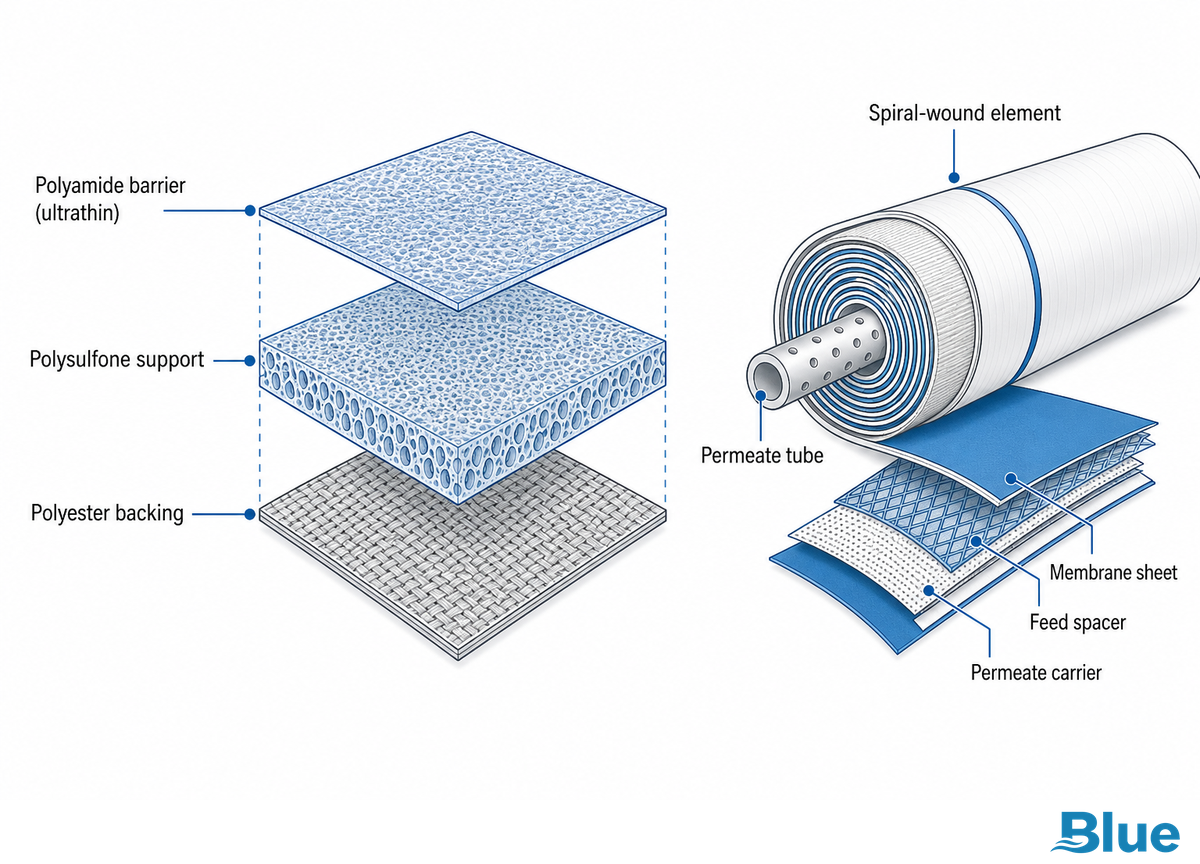
Almost every modern RO membrane is a thin-film composite, usually shortened to TFC. It isn’t one material but a stack of three: an ultrathin aromatic polyamide barrier layer (a fraction of a micron thick) that does the actual rejecting, a microporous polysulfone support beneath it, and a tough polyester fabric backing for strength. Peer-reviewed reviews of TFC polyamide membrane life cycles describe this same layered construction across the industry.
That flat sheet is then rolled. Sheets of membrane, feed spacers, and permeate carriers are wound in a spiral around a central perforated tube to make a spiral-wound element — the cylinder you actually buy and slot into a pressure vessel. Elements ship in two industry-standard diameters, 4-inch (4040) and 8-inch (8040), typically 40 inches long, which is why a well-designed replacement drops into the housing you already own. Picture a fresh element sliding into a pressure vessel: the flat sheet you started with is now a tightly wound cylinder, and any handling crease in that thin polyamide layer becomes a leak path that shows up as higher salt passage on day one — one reason elements are shipped and stored with care. The engineering history of these RO membrane elements is documented in MDPI’s Membranes journal.
⚠️ One material weakness worth knowing
Polyamide TFC membranes are intolerant of chlorine. Free chlorine — at levels many polyamide membranes cite around 0.1 ppm or above — will slowly oxidise the barrier layer and permanently raise salt passage. That is why RO systems dechlorinate the feed (carbon or bisulfite) before the membrane, not after.
The Main Types of RO Membranes: The 6-Class Map

There’s no universal “RO membrane.” Elements are engineered in classes, and the right class is set by your feedwater, its salinity, its fouling tendency, and the pressure your system runs. Match the class to the water first, then pick a model. The map below is how a manufacturer organises the lineup.
| Membrane class | Example series | Test pressure | Best-fit feedwater | Not suitable for |
|---|---|---|---|---|
| Low-pressure / ULP | MB-C1 / MB-C2 | 150–225 psi | Low-salinity tap / pure-water systems where energy cost matters | Seawater or high-TDS brine |
| Brackish water | MB-Z1 | 225 psi | Standard brackish and tap feed, high rejection | Seawater osmotic loads |
| Seawater | MB-H1 / MB-H2 | 800 psi (max 1,200) | Desalination, ~32,000 ppm NaCl | Low-pressure economy systems |
| Fouling-resistant | MB-Z2 | 225 psi (max 600) | High-fouling / reuse streams up to ~10,000 ppm TDS, wider 35-mil spacer | Clean low-fouling feed (wastes flux) |
| Residential / customized | Custom 50–1,600 GPD | By design | Point-of-use and light-industrial housings | Large municipal trains |
| OEM cross-reference | Class-matched equivalents | Per matched class | Replacing an existing FilmTec / Hydranautics / Toray element by class | Mixing brands within one vessel |
| High-recovery brackish | MB-Z1 (high-recovery design) | 225 psi | Well water and inland brackish where water efficiency matters | Scaling-prone feed without antiscalant |
| Nanofiltration (adjacent) | NF elements | ~100 psi | Softening / divalent-ion rejection, not full desalination | Monovalent salt removal |
| Zero-liquid-discharge (ZLD) | High-pressure elements | Up to 1,200+ psi | Maximising recovery on concentrated brines / minimal-waste plants | Standard low-pressure duty |
Table: the 6-Class RO Membrane Map, organise elements by feedwater and pressure, not by brand name.
As a practical rule: send a brackish-water element into seawater pressure and its chemistry and feed spacer are simply not built for that osmotic load, so it fails fast. If you run brackish feed, start with a brackish water RO element; for desalination you need a seawater RO membrane; energy-sensitive systems use low-pressure / ULP elements; and dirty or reuse water calls for a fouling-resistant membrane.
RO vs. NF, UF, and MF: Where RO Sits on the Filtration Spectrum
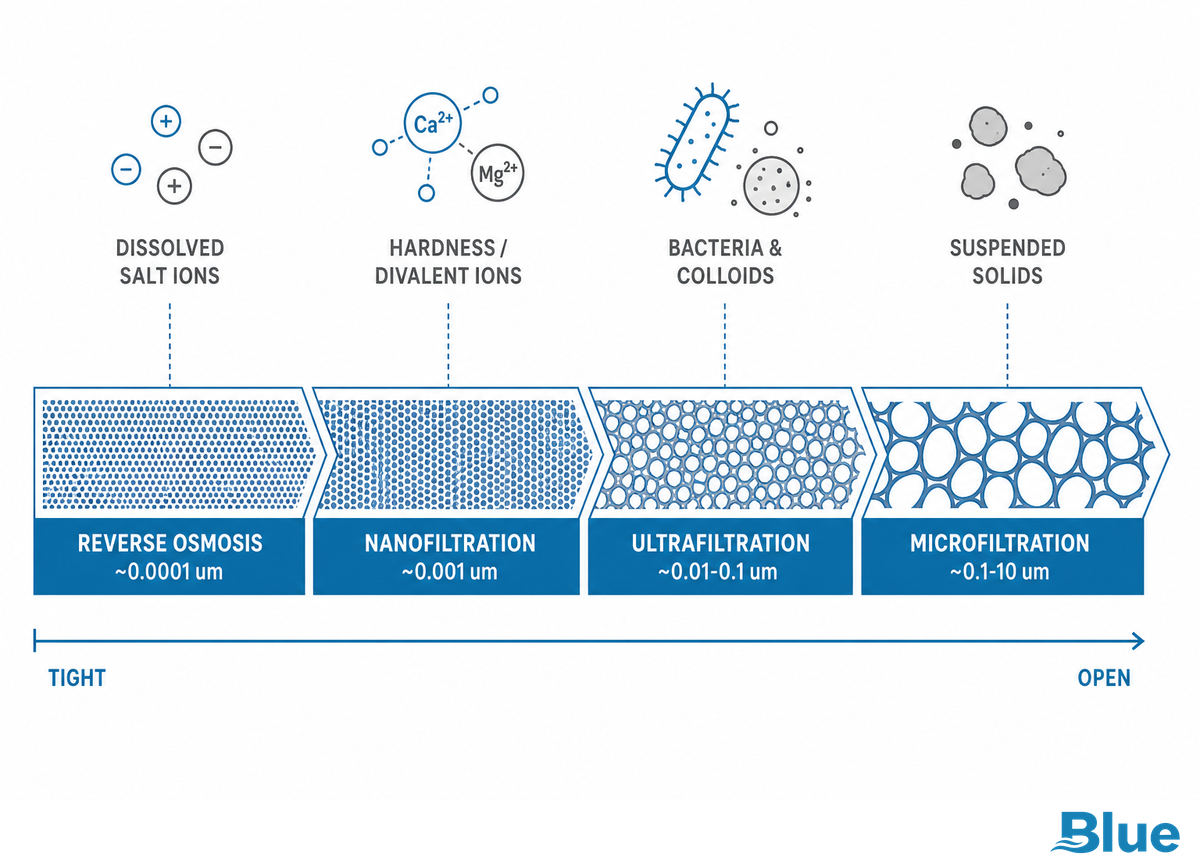
RO is the tightest of the four pressure-driven membrane processes. Nanofiltration, ultrafiltration, and microfiltration each open the pores wider and let more through, trading rejection for lower pressure and higher flow. Placing them side by side is the fastest way to see what an RO membrane actually does that the others can’t.
| Process | Nominal cutoff | What it removes | Typical pressure |
|---|---|---|---|
| Reverse osmosis (RO) | ~0.0001 µm | Dissolved salts (including monovalent), organics, almost everything | 150–800+ psi |
| Nanofiltration (NF) | ~0.001 µm | Divalent ions (hardness), larger organics; passes some monovalent salt | ~50–150 psi |
| Ultrafiltration (UF) | ~0.01–0.1 µm | Colloids, bacteria, macromolecules; passes dissolved salts | Low |
| Microfiltration (MF) | ~0.1–10 µm | Suspended solids, some bacteria; passes salts and most organics | Low |
If your goal is softening rather than full desalination, a nanofiltration membrane often makes more sense, it strips hardness at a fraction of RO’s pressure while leaving beneficial monovalent minerals in place.
The Numbers That Define Performance
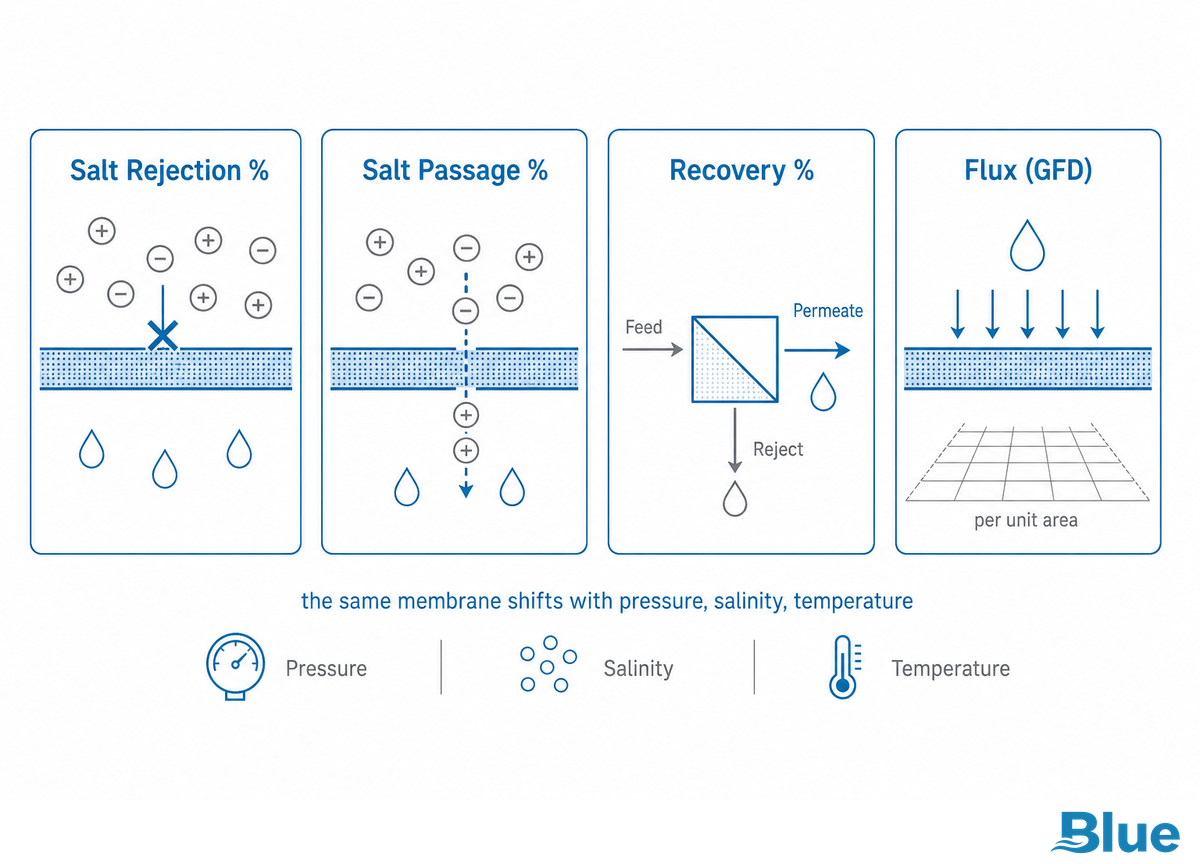
Four numbers describe how any RO membrane behaves: salt rejection, salt passage, recovery, and flux. All of them ultimately track how much of the feed’s total dissolved solids (TDS) the membrane holds back. Get comfortable with these and a datasheet stops being intimidating.
- ✔Salt rejection % — the share of dissolved solids the membrane removes: (feed conductivity − permeate conductivity) ÷ feed conductivity × 100. A field evaluation published by the Texas Water Development Board reported an average near 98% across the membranes it tested; your own number depends on membrane class and feed conditions.
- ✔Salt passage % — simply the inverse of rejection. Rising salt passage is your early warning that a membrane needs cleaning or replacement.
- ✔Recovery % — the fraction of feedwater that leaves as permeate. Commercial systems typically run 50–85%; larger industrial trains often reach 70–90%. Push recovery too high and you concentrate scale on the membrane.
- ✔Flux (GFD) — gallons of permeate per square foot of membrane per day. Many real systems run in the mid-teens, often around 15–17 GFD, with design ranges higher for clean permeate water and lower for seawater or effluent.
One catch trips up most buyers: rejection isn’t one fixed property. A single element is rated at a specific test pressure, feed salinity, and temperature. Change any of those and the number moves. Industrial RO elements are commonly rated at 99.5–99.8% rejection at their stated test pressure, but that figure only holds at the conditions printed beside it.
How Long RO Membranes Last, and What Wears Them Out
RO membranes don’t have a fixed expiry date, and the popular “replace every two to three years” rule is largely arbitrary. Field practitioners on water-treatment forums put it bluntly: two to three years is a safe default, not the correct age for any specific system. On soft water with good maintenance, users report four to six years, and carefully maintained membranes lasting close to a decade. The honest trigger is performance, not the calendar.
⚠️ Replace on data, not on a date
Track normalized permeate flow, salt passage, and pressure drop. A commonly used threshold is a 15% change from clean baseline — clean or investigate at that point rather than swapping elements because a calendar page turned.
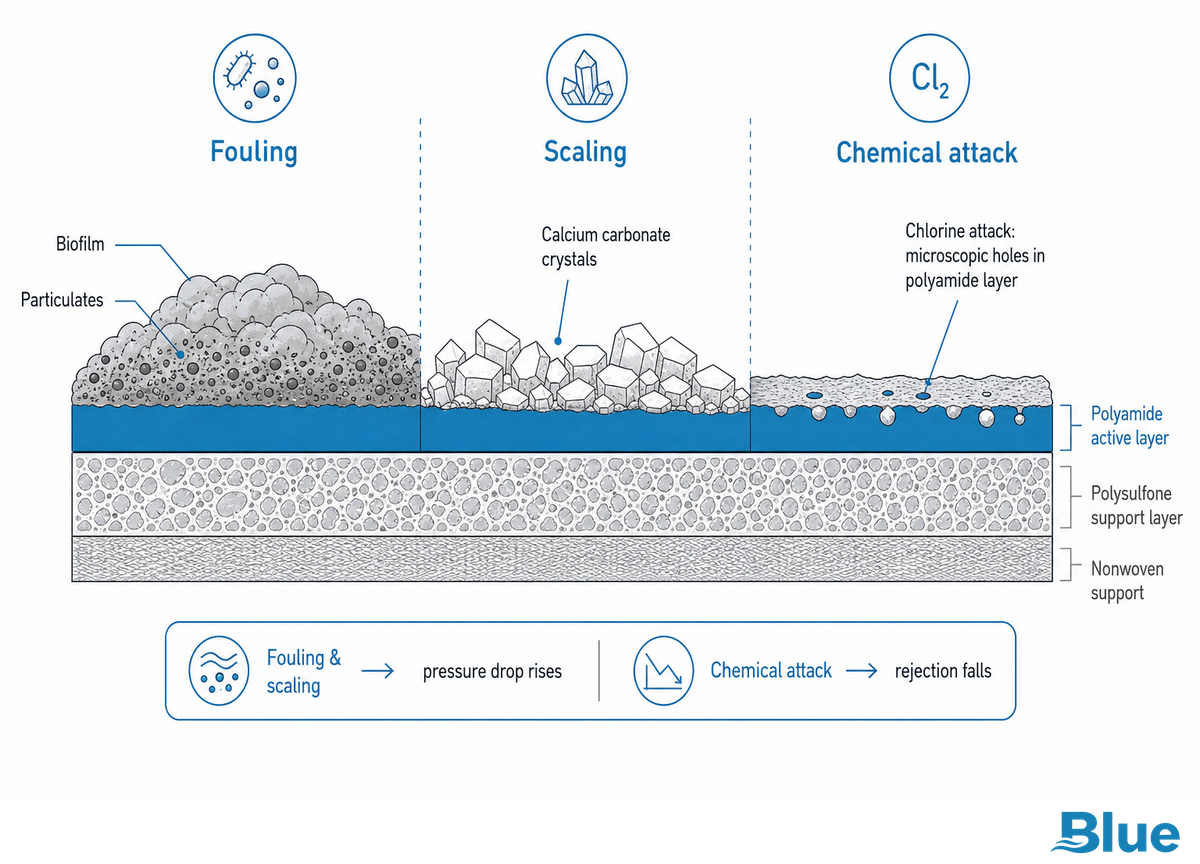
Three failure modes actually end a membrane’s life. Fouling — biological, organic, or particulate matter building on the surface, usually hits the front of the system and shows up as rising pressure drop and falling permeate flow. Scaling happens when dissolved minerals (calcium carbonate is the classic) exceed their solubility and precipitate as the concentrate gets denser. Chemical attack is the fast killer: chlorine or other oxidizers burn microscopic holes in the polyamide layer, raising permeate flow but destroying rejection. A 2024 review of RO desalination in ScienceDirect catalogues these same operational problems.
When a membrane is not the problem: if rejection collapses suddenly, suspect chlorine breakthrough or an O-ring bypass before condemning the element. If flow drops gradually, suspect fouling or scaling and try cleaning first. Swapping the membrane without fixing the upstream cause just repeats the failure on the new one.
Picture a small commercial system running on chlorinated municipal water with a spent carbon filter nobody replaced. Within a few weeks salt passage climbs, and an operator who books an RO membrane replacement on the calendar keeps fitting fresh elements that fail the same way. The real fix sits upstream: restore dechlorination, add a scheduled RO membrane cleaning routine, and check the pressure vessel and RO membrane housing seals before condemning another element. Most types of RO membrane failure trace back to feedwater, not to the element itself.
How to Read an RO Membrane Datasheet
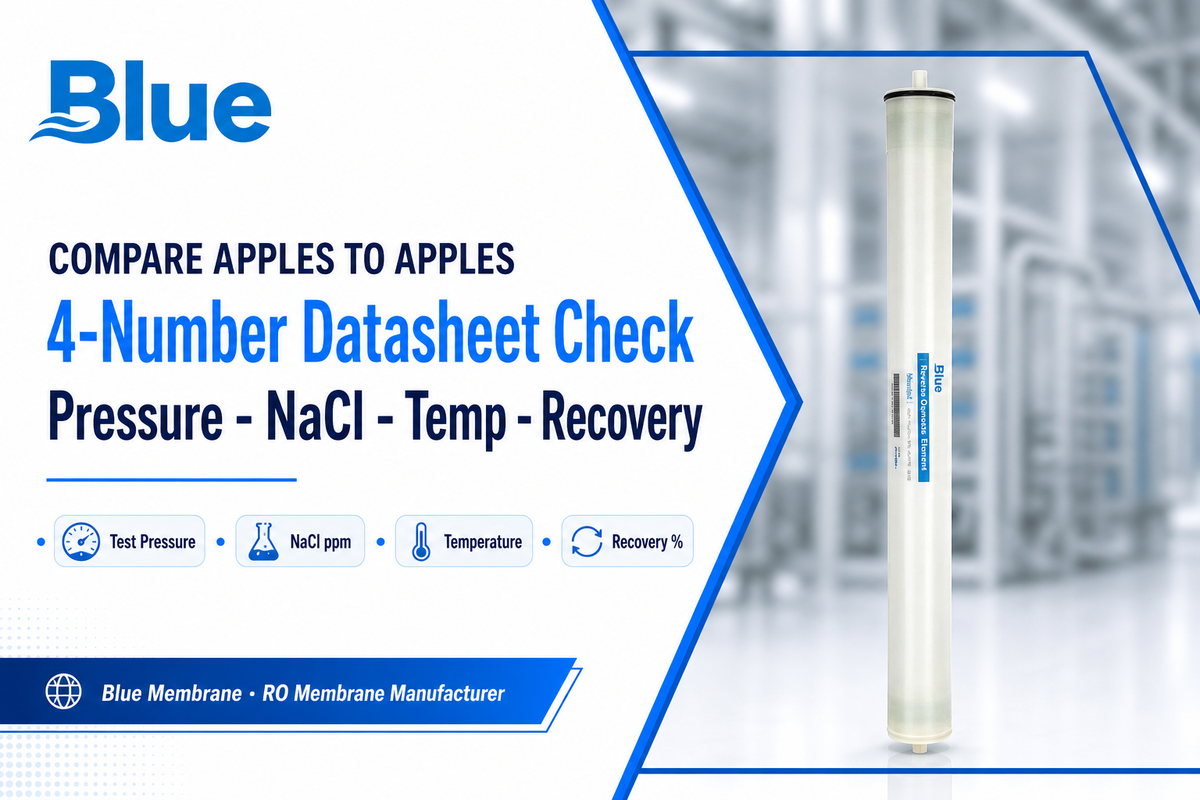
One skill matters most when comparing membranes: reading a datasheet honestly. A bare rejection percentage is marketing; a rejection percentage with its test conditions is data. Before you compare two elements, line up four numbers.
The 4-Number Datasheet Check
- Test pressure — 150 psi and 800 psi are different worlds. Compare like with like.
- NaCl concentration — a rejection figure at 2,000 ppm isn’t comparable to one at 32,000 ppm.
- Temperature — usually 25 °C; colder water is more viscous and lowers flow.
- Recovery — the per-element recovery the test assumed.
Here’s why it matters, drawn from our own published datasheets. Blue Membrane’s H1 and H2 seawater series are rated under identical test conditions, 800 psi, 32,000 ppm NaCl, 25 °C, which is exactly what makes them comparable:
| Element | Permeate flow (8040) | Salt rejection | Design intent |
|---|---|---|---|
| MB-H1-8040 | 7,500 GPD | 99.8% / 99.7% | Maximum rejection |
| MB-H2-8040 | 9,000 GPD (+20%) | 99.7% / 99.6% | Energy efficiency |
Same conditions, and yet H2 delivers 20% more water while H1 holds a slightly higher rejection margin. Neither is “better” — it’s a design trade-off between rejection and energy, and only visible because the test conditions match. That’s the whole point of the check.
“All of our cross-reference models list the actual test pressure and NaCl concentration they were tested at, not just a rejection percentage. If a buyer is matching one of our elements against a FilmTec or Hydranautics number, they should compare apples to apples.”
Standardised test methods make this comparison possible in the first place. Most industrial elements are tested under ASTM D4516, the standard practice for RO and NF spiral-wound and hollow-fiber performance. When you cross-reference brands, match by rejection class using a documented OEM cross-reference chart rather than by housing size alone.
Where RO Membrane Technology Is Heading
The two forces reshaping RO membranes aren’t new materials for their own sake, they’re the energy cost of every gallon produced, and what happens to a membrane when it dies. Both are pushing the same direction: gentler chemistry that rejects just as well at lower pressure, and elements that don’t simply become landfill.
On the energy side, 2025 research continues to refine thin-film composite polyamide chemistry for higher permeability at a given rejection, so systems can hit target water quality at lower feed pressure, and lower pump energy. Recent work on advanced TFC fabrication in Scientific Reports is representative of the direction.
On the waste side, the scale of the problem is now hard to ignore: a study in MDPI’s Membranes journal estimated that RO desalination would generate more than 2,000,000 end-of-life membranes worldwide every year by 2025, driving active research into membrane recycling and reuse. Meanwhile the rulebook is moving too, the current point-of-use standard is NSF/ANSI 58-2025, and the EPA has been updating its WaterSense specification for point-of-use RO systems with explicit water-efficiency and performance criteria. That distinction matters: a residential point-of-use membrane runs a very different recovery and wastewater profile than an industrial element, and removal claims are certified contaminant-by-contaminant rather than as a blanket “removes everything.” Picture a buyer specifying a desalination skid for a 2026 project: the elements quoted today already lean toward lower-energy chemistry, and the certification bar is rising under them. Expect lower-energy elements and tighter certification to be the baseline, not the premium option.
Frequently Asked Questions
What is the purpose of an RO membrane?
View Answer
The RO membrane is the component that actually removes dissolved contaminants from water. Everything else in a reverse osmosis system — pumps, pre-filters, pressure vessels — exists to feed and protect it. By rejecting salts, organics, and other dissolved solids down to roughly 0.0001 micron, the membrane turns feedwater into purified permeate, which is why it is considered the heart of any RO system.
What is the pore size of an RO membrane?
View Answer
RO membranes separate at roughly 0.0001 micron, about 0.1 nanometre — the scale of individual dissolved ions. In practice the polyamide layer is dense rather than porous like a sieve, so “pore size” is really an effective separation threshold. That is far tighter than nanofiltration (~0.001 micron) or ultrafiltration (~0.01–0.1 micron), which is why RO removes dissolved salt while looser membranes do not.
What is the difference between an RO membrane and a UF membrane?
View Answer
An ultrafiltration (UF) membrane has much larger openings, around 0.01–0.1 micron. It removes colloids, bacteria, and large molecules but lets dissolved salts pass straight through, so it runs at low pressure and does not desalinate. An RO membrane separates about a thousand times finer, rejecting dissolved ions as well — but it needs far more pressure to do it. Use UF to clarify; use RO to remove dissolved solids.
Can reverse osmosis membranes remove radon?
View Answer
Not reliably — radon is a dissolved gas, and RO handles dissolved gases poorly. Use aeration or granular activated carbon instead.
Is RO water safe to drink every day?
View Answer
Yes. RO water is widely used for drinking and is treated as safe by health and regulatory bodies. Because RO also removes beneficial minerals such as calcium and magnesium, some systems add a remineralisation stage for taste and to raise the slightly low pH that can result from dissolved carbon dioxide. That is a preference and system-design choice rather than a safety requirement for most households.
Do all RO membranes fit the same housing?
View Answer
Industrial spiral-wound elements share standard housing dimensions — most commonly 4040 (4-inch) and 8040 (8-inch) diameters — so a correctly chosen replacement drops into your existing pressure vessel without plumbing changes. Fitting, though, is not the same as matching. A membrane can slide into the housing yet be wrong for your feedwater or built to a different rejection class than the elements beside it. Always match by rejection class and test conditions, verify the end-cap and O-ring dimensions, and never mix membrane brands or generations within a single vessel: newer elements take excess flow while the older ones become overloaded and foul early. When in doubt, replace the whole vessel on a matched-class basis rather than swapping a single element.
Need to match an RO membrane to your feedwater?
Blue Membrane manufactures six spiral-wound element lines and publishes documented test conditions on every model. Tell us your feedwater and housing, and we’ll point you to the right class.
Or use the OEM Cross-Reference Finder to see the closest documented equivalent to the element you run now.
Why We Wrote This
Blue Membrane engineers and manufactures reverse osmosis and nanofiltration elements, so the class map and the H1-versus-H2 datasheet example above come from our own published test-condition data. We wrote this guide because too many membrane specs quote a rejection percentage without the pressure and salinity behind it, and buyers deserve to know how to read one honestly.
References & Sources
- Reverse Osmosis, Inspection Technical Guide — U.S. Food and Drug Administration
- Point-of-Use Reverse Osmosis Systems — U.S. Environmental Protection Agency (WaterSense)
- Reverse Osmosis (StatPearls) — National Library of Medicine (NIH)
- Reverse Osmosis — University of Minnesota Extension
- RO Membrane Performance Evaluation — Texas Water Development Board
- Thin-Film Composite Polyamide RO Membrane Life Cycle — PMC / National Institutes of Health
- RO Membrane Engineering Review — Membranes (MDPI), 2024
- Advanced Fabrication of Thin-Film Composite Membranes — Scientific Reports (Nature), 2025
- End-of-Life RO Membrane Volume & Reuse — Membranes (MDPI)
- Review of Reverse Osmosis Desalination — ScienceDirect, 2024