Get in touch with Blue Membrane Company

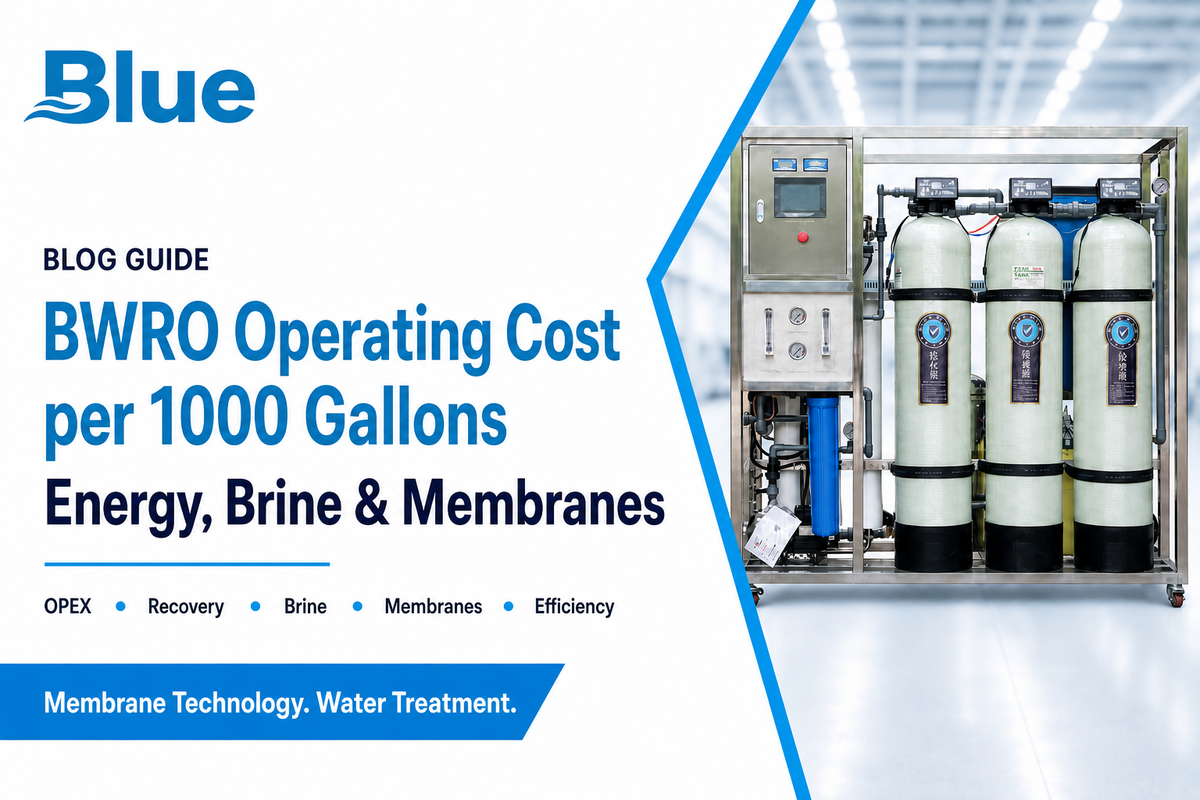
BWRO Operating Cost per 1000 Gallons refers to plant-side operating expense for a brackish water reverse osmosis desalination system, not the delivered water tariff. Public BWRO data often lands around USD 0.39-0.66 per cubic meter, or approximately USD 1.48-2.50 per 1,000 U.S. gallons of permeate. This average cost should be treated as a screening benchmark; actual price quotes depend on source water, recovery, power tariff, chemical program, membrane replacement, labor, and concentrate disposal.
Buyers often request operating cost on a per-1,000-gallon basis because the figure appears simple, a per gallon value. However, brackish water reverse osmosis costs are rarely simple. Reverse osmosis system expenses can vary dramatically from one raw water source to another because water salinity, total dissolved solids, sulfate levels, silica content, iron presence, organic matter, pump efficiency, and the brine discharge all influence the operating cost.
This document breaks down operating costs from capital expenses, explaining how to construct a reliable estimate. It’s designed for engineers like water treatment, partners in the original equipment manufacturer space, distributors, and decision-makers such as industrial facilities who need to develop a brackish water RO planning model prior to approaching membrane vendors or system integrators for quotations. At Blue Membrane, we produce membrane sheets and spiral-wound elements for reverse osmosis; this discussion focuses on the role of membrane selection and doesn’t imply field-level cost savings without specific project details.
What Is the Typical BWRO Operating Cost per 1000 Gallons?
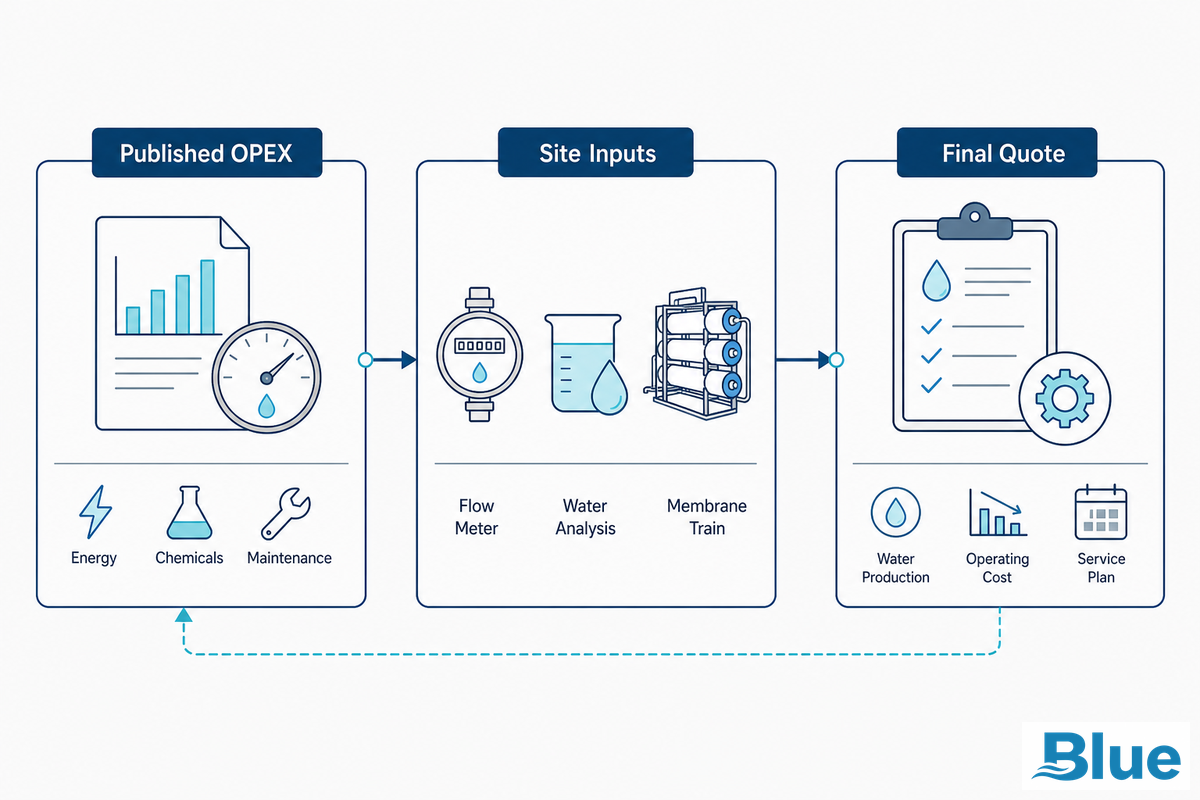
A credible initial estimate is USD 1.48-2.50 per 1,000 gallons for plant-side OPEX. The number comes from public USD 0.39-0.66 per cubic meter BWRO data, converted with 3.785 cubic meters per 1,000 U.S. gallons. It is an operating estimate, not a total project cost or guaranteed quote. See the FGCU Scholars Commons BWRO economics record.
This figure doesn’t represent the cost of water delivered to a consumer’s water meter. It excludes distribution systems, well fields, storage, civil infrastructure, financing, owner overhead, and some permitting work. Public water production costs and the cost of desalination can also include local intake, concentrate, and conveyance items, so published costs for desalination should be used as planning context, not a vendor quote.
Field planning note: when a buyer compares a 50,000 gal/day skid with a 250,000 gal/day commercial train, the per-gallon number usually shifts because fixed labor, cartridge filters, service travel, and spare elements are spread across different production volumes. Use the range as a screening number, then rebuild it based on system type, actual recovery target, and brine outlet.
Always keep the following conversion factors in mind when working with cost estimates: $0.39 per cubic meter is approximately $1.48 per 1,000 gallons; $0.66 per cubic meter is approximately $2.50 per 1,000 gallons; and electricity costs at $0.12 per kilowatt-hour with an energy consumption of 1.0 kWh per cubic meter equate to about $0.45 per 1,000 gallons. Per liter comparisons should not be copied into BWRO plant OPEX without unit conversion. Different operating pressures, such as 150 psi, 250 psi, or 400 psi, will result in different pump duty for the system.
| Cost basis | What it includes | Why buyers confuse it | How to use it |
|---|---|---|---|
| Plant-side operating expense | Power, chemicals, filter changes, cleaning, membrane replacement, labor, disposal | It looks like the answer to cost per gallon | Use for operating-cost modeling and vendor comparisons |
| Production cost | OPEX plus capital recovery for the treatment process | Often quoted as cost per cubic meter or per 1,000 gallons | Use for planning-level economic screening |
| Delivered water cost | Treatment, pumping, storage, distribution, finance, administration | Municipal reports may mix treatment and infrastructure | Use for owner budget decisions, not membrane selection alone |
| Quote-level project cost | Equipment, install, controls, commissioning, civil works, spares | It changes with scope and site layout | Use after feed analysis and recovery basis are fixed |
The 7-Line BWRO Cost Stack
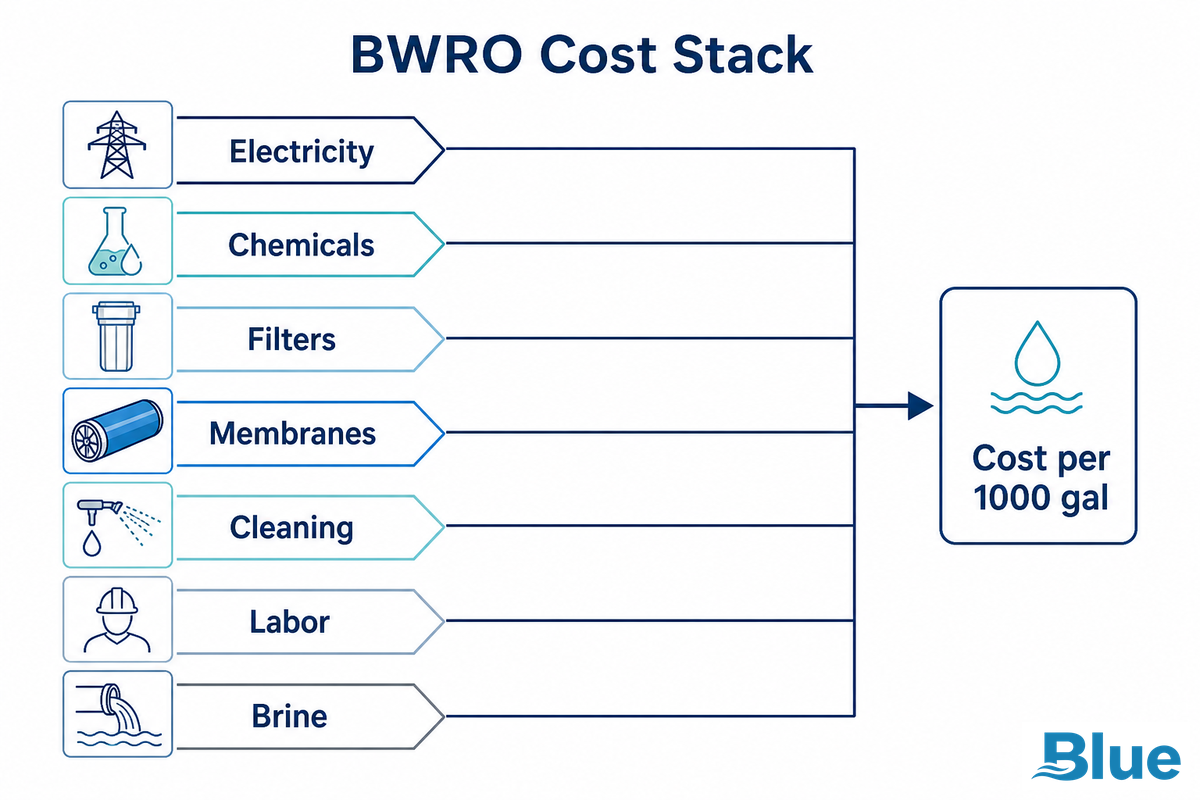
Using the 7-Line BWRO Cost Stack provides the quickest way to steer clear of generic reverse osmosis system cost discussions. This stack starts with electricity costs but extends beyond that to include other factors. A report on desalination costs in Texas by the Texas Desalination Working Group offers a historical perspective on capital costs, operating costs, O&M ranges, and overall production cost per 1,000 gallons, although this data shouldn’t be relied upon as current vendor quotations for 2026 (see TWDB cost of brackish groundwater desalination in Texas).
| Cost line | Unit input | Example calculation logic | Why it moves |
|---|---|---|---|
| Electricity | kWh/m3 x USD/kWh | SEC x tariff x 3.785 = dollars per 1,000 gallons | Operating pressure, recovery, pump efficiency, feed salinity |
| Pretreatment chemicals | Dose x unit price | Antiscalant, acid, SMBS, pH control divided by water volume | Scale risk, oxidants, raw water stability, water quality |
| Cartridge or media filter replacement | Filter price x change frequency | Monthly filter spend divided by permeate gallons | SDI, turbidity, biofilm, upstream filtration |
| Membrane replacement | Membrane set cost / service gallons | Element set cost amortized into cost per gallon | Fouling rate, cleaning success, chlorine control, element fit |
| Cleaning in place | CIP events/year | Chemicals, labor, lost production, rinse water use | Scaling, biofouling, flux decline, feed water quality |
| Labor and service | Hours/month | Operator hours plus service contract allocation | Plant size, automation, alarms, monitoring discipline |
| Concentrate disposal | Brine volume x route cost | Reject flow routed to sewer, surface discharge, injection, pond, hauling, MLD, or ZLD | Recovery, permit route, TDS, local receiving water, site location |
| Downtime reserve | Hours lost x value of water | Lost product water or temporary water purchase | Spare parts, membrane stock, maintenance planning |
| Water-quality verification | Samples/month | Lab and instrument costs allocated to output | Drinking water requirements, industrial process risk, reuse permits |
Never compare two RO system costs unless they use the same product water basis. Don’t assume an estimated 100,000 gallons per day, 80% recovery, local sewer discharge case is the same as an estimated 40,000 gallons per day, 70% recovery, hauled concentrate case. Even with two plants with brackish water RO systems, the cost factors could be different.
Why Energy Cost Changes the Number Fast
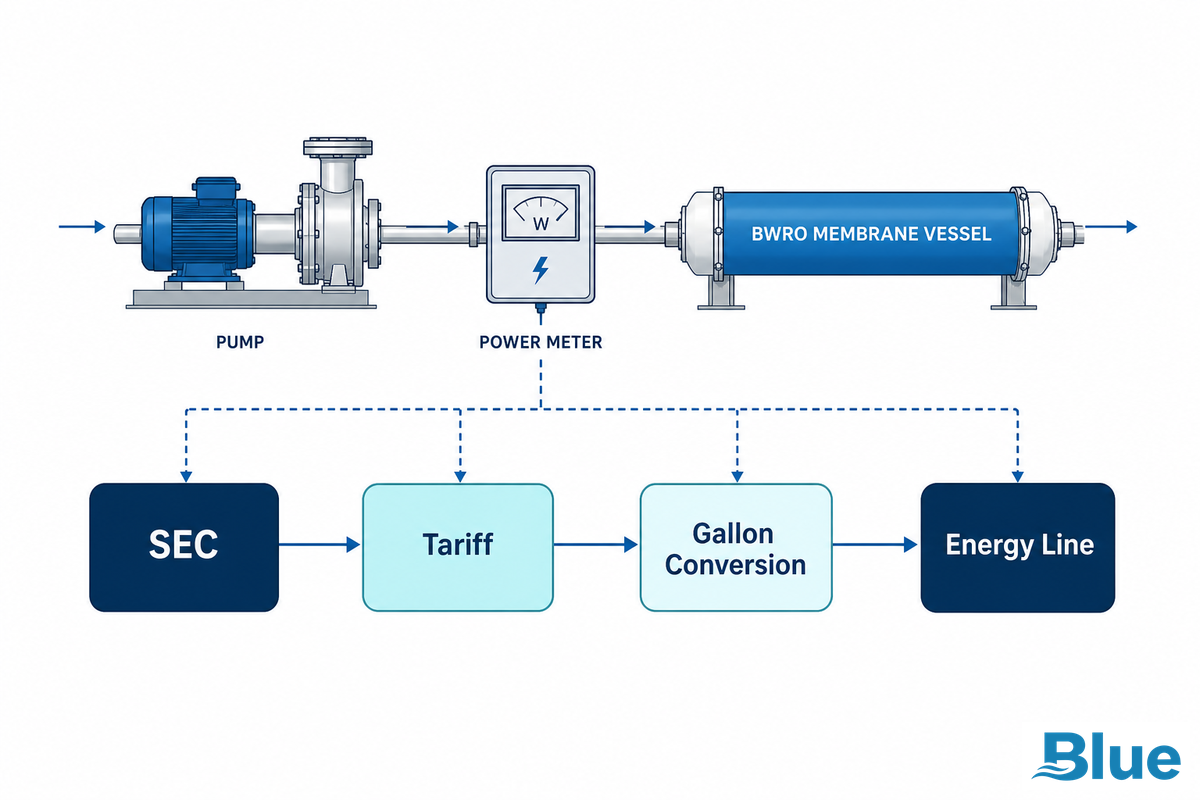
Energy cost changes fast because SEC, tariff, pump efficiency, recovery, and feed pressure all multiply together. For a BWRO plant, model the electrical line as SEC kWh/m3 x electricity tariff USD/kWh x 3.785 = electricity dollars per 1,000 gallons; then test the result against expected operating pressure and daily flow.
If a BWRO train uses 0.90 kWh/m3 and power costs USD 0.12/kWh, electricity contributes about USD 0.41 per 1,000 gallons. If the same plant runs at 1.40 kWh/m3 and power costs USD 0.18/kWh, the electrical cost rises to about USD 0.95 per 1,000 gallons. That’s only one line in the stack, but it’s visible because energy consumption shows up every day on the meter.
An open-access BWRO retrofit study from 2026 documented that plant-wide SEC dropped from 0.82 to 0.73 kWh/m3 when an isobaric energy recovery device was installed on a 2,400 m3/d train with 80% recovery. Treat this as a boundary condition, not a guarantee for all small skids (2026 BWRO energy-recovery study). For planning a public infrastructure investment for desalination, use TWDB desalination facts as a public-sector reference.
Realized operating cost can vary even when the equipment is the same due to power dispatch. A 2026 arXiv paper explored how to use coordinated operation with variable-speed pumps, flushing schedules, water quality parameters, storage tank salinity and scheduling to reduce electrical energy use up to 6% for RO facilities (arXiv RO coordination study). This isn’t meant to replace the simple SEC equation, but rather to illustrate why two facilities with similar RO technology could still have very different electricity costs.
TDS-to-Pressure Map: Feed Quality Is More Than Salt
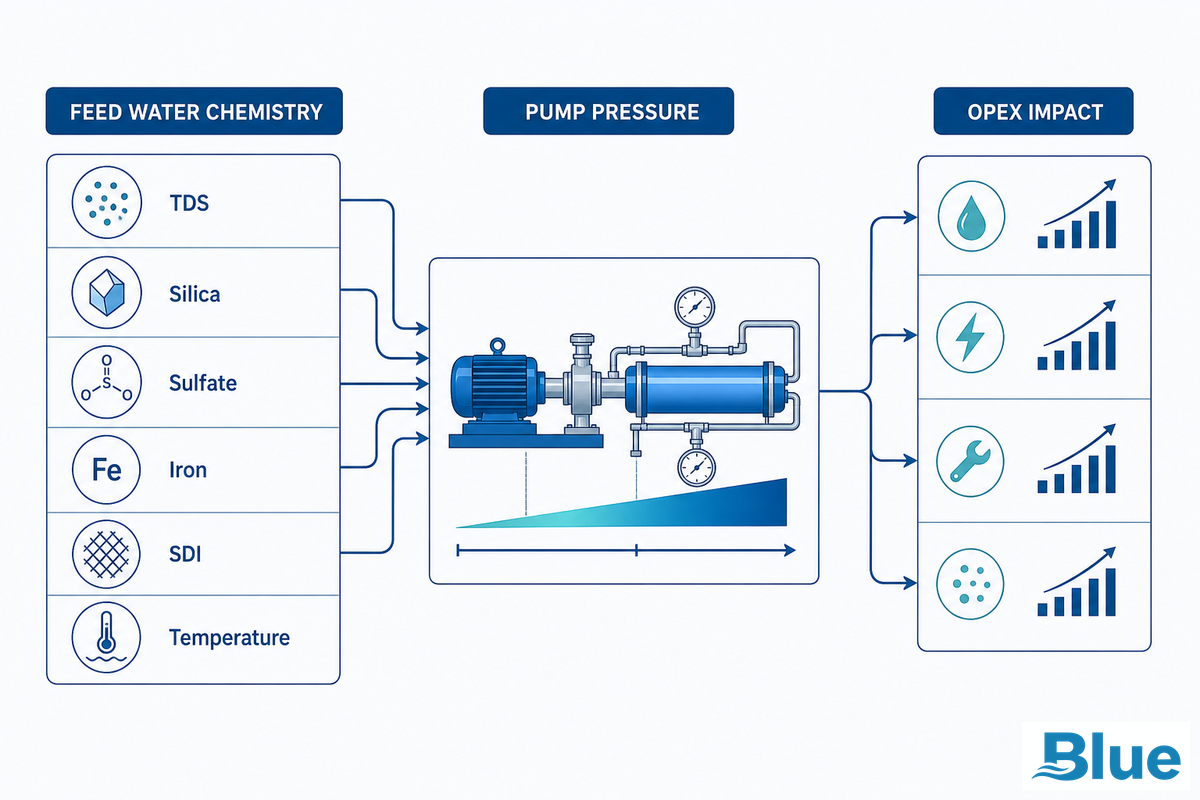
TDS becomes relevant because higher TDS corresponds with a greater osmotic pressure, thus requiring a higher pump pressure to operate brackish water RO on higher-TDS feed. But water salinity isn’t the sole cost factor. Other components of the feed water such as silica, sulfate, hardness, iron, manganese, barium, organics, SDI, turbidity, temperature, chlorine, and biology all affect water quality and maintenance cost in reverse osmosis.
| Feed factor | Cost path | What to check before quote |
|---|---|---|
| TDS 2,000-6,000 mg/L | Raises pressure and energy use, but not always linearly | Full ion profile, temperature, target permeate quality |
| Silica | Limits recovery and can force higher concentrate volume | Silica form, pH, antiscalant fit |
| Sulfate and hardness | Creates scale risk as recovery rises | Calcium, barium, strontium, sulfate saturation |
| Iron and manganese | Can foul membrane surfaces and cartridge filters | Oxidation state, filtration route, cleaning plan |
| Organics and bioactivity | Increases biofouling, CIP frequency, and pressure loss | TOC, bacteria, upstream disinfection, carbon risk |
| Chlorine exposure | Can damage polyamide reverse osmosis membranes | Dechlorination, ORP control, SMBS dosing |
| Temperature | Changes flux, normalized flow, and pressure demand | Seasonal feed temperature and correction factors |
| SDI and turbidity | Moves filter spend, cartridge change rate, and membrane fouling | SDI15, turbidity peaks, pretreatment pilot data |
| Target product water | Changes pass count, rejection need, and membrane class | Conductivity, boron, chloride, process limits, drinking water rules |
Lower-pressure RO technology can reduce the energy line for lower-TDS feed water, as discussed in Blue Membrane’s low-pressure membrane guide. Cost comparison for seawater reverse osmosis desalination can be found in the seawater RO systems guide, where higher pressures and brine management costs of SWRO are addressed. To plan BWRO facilities on local feed waters, compare against public OPEX estimates such as from the FGCU BWRO economics record, or use site-specific scope defined in TWDB projects.
Membrane Replacement, Fouling, and Cleaning Cost
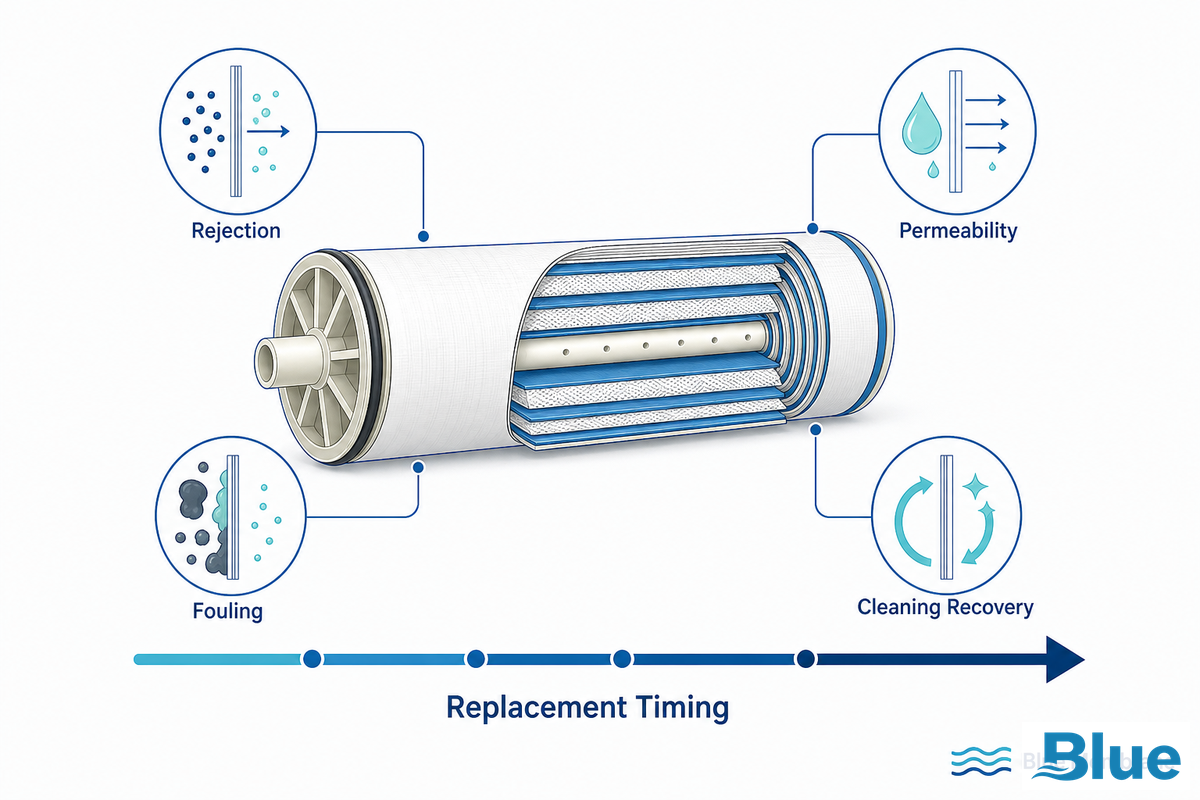
However, it’s important not to equate membrane element purchase price with lifecycle cost. Elements with lower initial cost can be more expensive over their lifespan due to increased pressure requirements, a higher rate of normal flow reduction, poor salt rejection that exceed process need, or more frequent cleaning cycles. A 2025 review covers the impact of membrane fouling on production loss, water quality, energy demand, and maintenance demand (2025 RO membrane fouling review). Patent literature often defines design criteria in membrane separation systems as the desired trade-off between energy, recovery, and pressure losses (Google Patents membrane pressure-exchanger example).
Membrane Lifetime Guardrail: Membrane cost shouldn’t be calculated by the element alone. Compare membranes by dollars per 1,000 gallons of stable product water, not only by element invoice price. For Blue Membrane customers, that means asking how rejection, permeability, membrane chemistry stability, and fouling resistance fit the feed water and cleaning plan. A cost effective membrane decision is the one that supports high quality water targets without forcing extra pressure, cleaning, or premature replacement. Supply reliability also belongs in the operating-cost discussion, because a plant that can’t get matched spare elements on time may have a hidden downtime reserve.
- Confirm feed oxidants, dechlorination, and antiscalant compatibility before selecting the membrane.
- Compare rejection and permeability at the target operating pressure, not only at a standard data-sheet test point.
- Track normalized flow, salt passage, and differential pressure weekly.
- Clean based on measured decline, not on a calendar date alone.
- Record post-clean flow recovery so membrane replacement can be planned before emergency failure.
- Set site-specific warning bands, such as a 10% normalized-flow drop, a 15% salt-passage increase, or a 30 day pressure trend review, before the plant reaches emergency cleaning.
- Build a spare-element plan for industrial facilities where produce water demand can’t stop.
- Ask whether the element class is a standard brackish water RO membrane, high-rejection brackish element, or lower-pressure product water membrane.
- Separate membrane replacement cost from the broader reverse osmosis system cost and total cost of ownership.
- Calculate replacement as dollars per year and dollars per 1,000 gallons, then compare both.
Brine Burden Multiplier
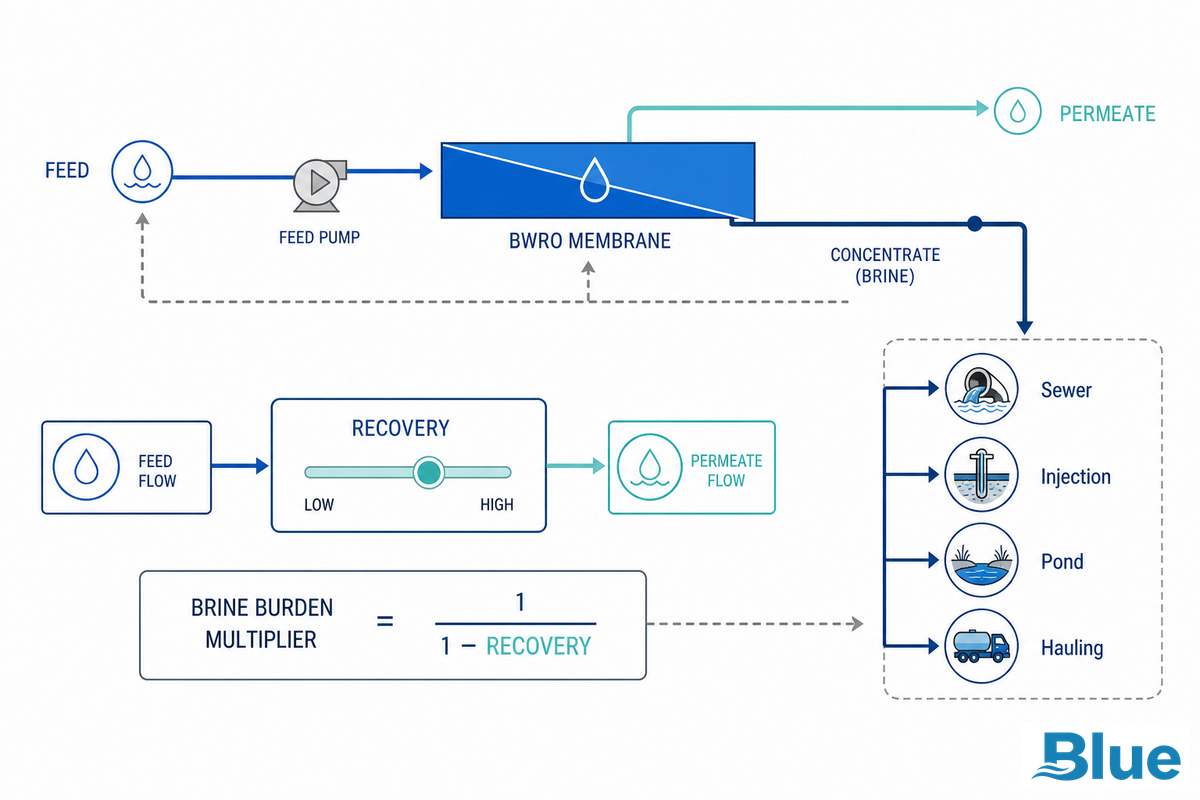
Brine Burden Multiplier: the part of BWRO cost that gets missed when the estimate stops at pump energy. If a plant runs at 75% recovery, 25% of the feed becomes concentrate. At 80% recovery, only 20% becomes concentrate, but the concentrate has about five times the original salt concentration. This concentration-factor math is a definition, not a dated market price: concentration factor = 1 divided by (1 – recovery). Water Online’s recovery-rate explanation shows how concentration factor climbs from 4 at 75% recovery to 5 at 80%, and to 10 at 90% recovery (RO recovery and concentration factors).
That higher concentration factor can add scale risk, chemical use, cleaning, and disposal limits. EPA’s NPDES permit framework is relevant when concentrate is discharged to surface water or through a regulated pathway (EPA NPDES permits). TWDB’s cost report also keeps concentrate disposal inside the planning frame for brackish groundwater desalination (TWDB brackish groundwater desalination cost report).
| Disposal route type | Operating-cost signal | Cost risk | Evidence to collect |
|---|---|---|---|
| WWTP or sewer discharge | May be lower direct cost where accepted | Capacity limits, TDS limits, surcharge, permit burden | Acceptance letter, discharge limit, monthly volume |
| Surface discharge | Can look cheap on pumping distance | NPDES review, toxicity testing, salinity impact | Permit path, receiving-water data, monitoring cost |
| Deep-well injection | Often capital-heavy with monitoring | Well availability, geology, energy, reporting | Injection permit, pressure, well capacity, brine analysis |
| Evaporation pond | May reduce mechanical equipment | Land, climate, liners, residual salt management | Evaporation rate, pond area, seepage controls |
| Hauling | Simple for small or temporary systems | Truck distance, fuel, disposal fee, downtime | Gallons per day, hauling contract, road access |
| Minimal liquid discharge | Can reduce reject volume before final disposal | More equipment, chemicals, energy, maintenance | Recovery target, scaling control, residual outlet |
| Zero liquid discharge | May be required where discharge route is blocked | High energy costs, solids handling, capital and operating costs | Evaporator/crystallizer basis, solids disposal plan |
| Beneficial reuse of concentrate | Can offset some disposal cost | Quality fit, demand timing, liability, permits | End-use specification, salt profile, seasonal demand |
| Second-pass concentrate treatment | Can produce more water and reduce waste volume | Higher pressure, stronger brine, different membrane class | First-pass brine chemistry, secondary RO design, cleaning plan |
This is why brackish water reverse osmosis can be cheaper than seawater reverse osmosis on pressure and still carry a higher cost in a difficult inland site. Desalination cost is local when the brine outlet is local.
Example Planning Ranges by BWRO Profile
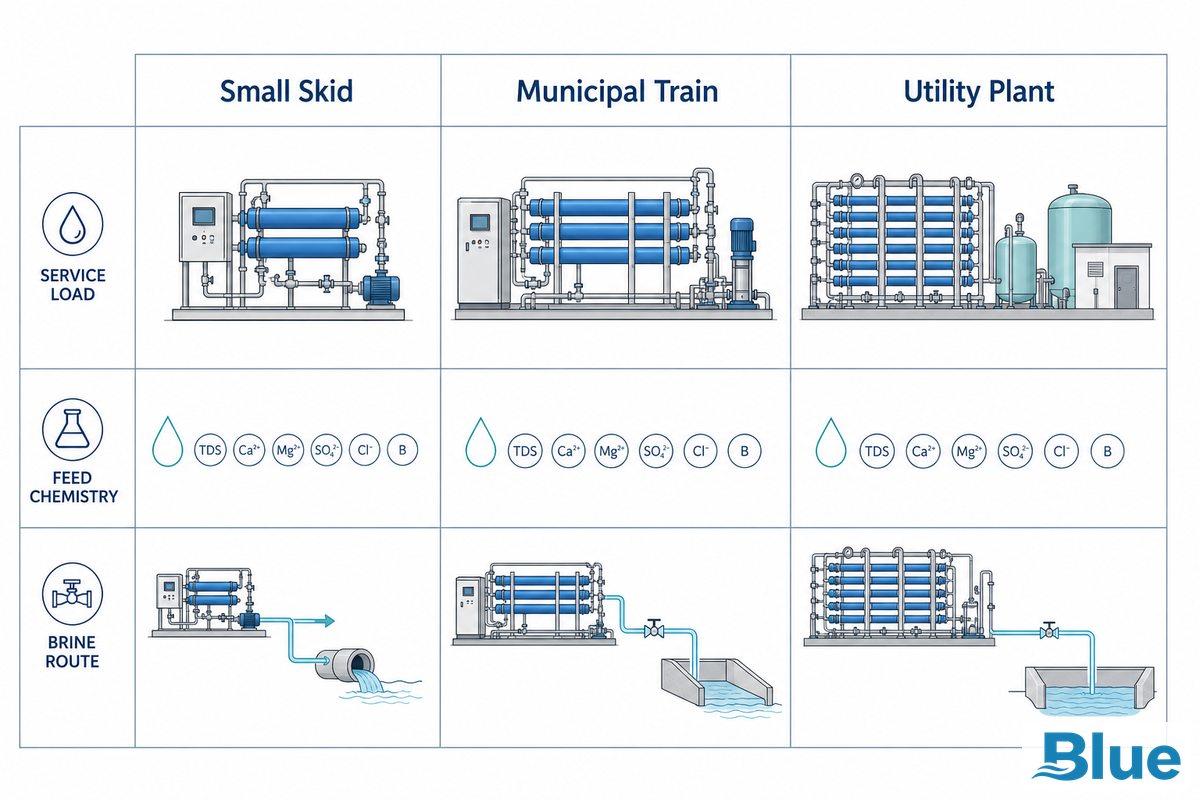
Use planning profiles to test whether your cost estimate is believable. TWDB’s facts page lists 53 municipal desalination facilities in Texas with 157 million gallons per day of capacity, including brackish groundwater and brackish surface water facilities (TWDB desalination facilities summary). That public capacity base is a reminder that BWRO isn’t one system type.
| BWRO profile | Typical flow basis | Why per-gallon cost moves | Planning caution |
|---|---|---|---|
| Small industrial skid | 5,000-50,000 gallons per day | Fixed labor, filters, controls, and membrane replacement spread over fewer gallons | Monthly operating cost may look high even when membrane price is low |
| Commercial reverse osmosis train | 50,000-250,000 gallons per day | Better volume base, but feed water quality and service model still matter | Commercial reverse osmosis cost should not be copied from tap-water RO |
| Municipal brackish groundwater plant | 0.25-5.0 million gallons per day | Scale helps power and labor allocation; disposal and wells add scope | Separate treatment OPEX from infrastructure and financing |
| Industrial process water reuse | Based on process discharge and reuse demand | Source water can contain organics, hardness, solvents, or temperature swings | Water reuse economics depend on avoided discharge and replacement water |
| High-recovery inland system | Permeate target plus brine-reduction target | Higher recovery reduces water volume but raises scale and brine strength | Do not chase recovery without concentration-factor math |
| Two-pass or high-purity system | Final product water quality target | Second pass adds pump energy, membrane set, controls, and reject flow | Cost to treat depends on rejection requirement, not only TDS |
| Remote or off-grid BWRO | Daily demand plus storage | Power cost, spare parts, operator access, and downtime carry more weight | Electrical cost and maintenance logistics can exceed membrane price |
| Retrofit to existing RO system | Current permeate gallons per day | Existing pumps, vessels, controls, and pretreatment set the boundary | Energy recovery devices need flow and pressure fit |
| Drinking water system | Permit capacity and compliance samples | Testing, monitoring, operator certification, and public reporting add cost | Do not compare directly with bottled water or under-sink purified water claims |
How to Lower BWRO Operating Cost Without Hurting Water Quality
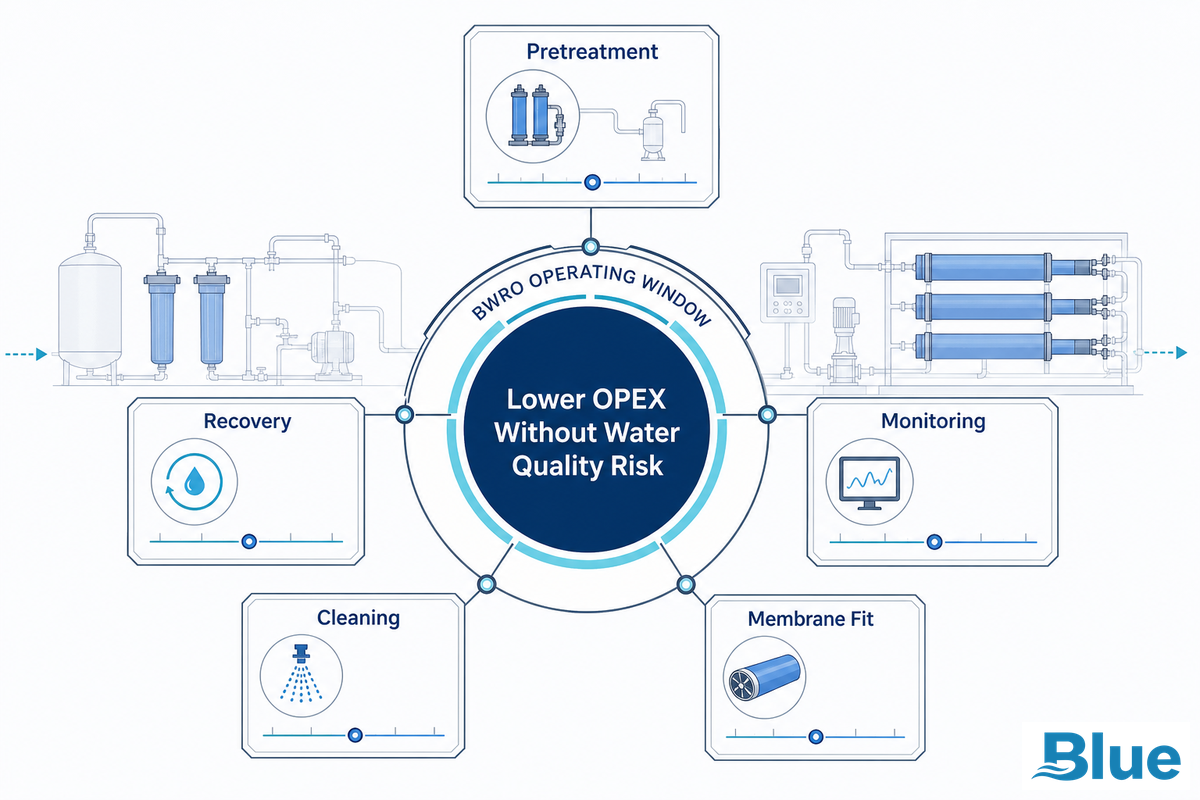
The safest cost-cutting start with the feed, not a lower membrane bid. Pretreatment fit, membrane class, recovery target, cleaning timing, and monitoring all influence long-term operating cost. Blue Membrane’s nanofiltration membrane guide applies if hardness and partial salt rejection factor into the front-end discussion; the RO membrane products page is the place to look next if the system designer need support for element selection.
Run the cost work in this order:
- Confirm raw water chemistry and target product water quality.
- Set recovery around scaling limits, not only water production goals.
- Pick pretreatment that lowers SDI and protects the membrane without chemical conflict.
- Select the reverse osmosis membrane class for feed water quality, operating pressure, and rejection requirement.
- Use normalized data for cleaning timing and membrane replacement.
- Model electrical cost with SEC, tariff, and operating hours.
- Price concentrate disposal before raising recovery.
- Keep capital cost, monthly operating cost, and total cost of ownership separate in columns.
- Verify if energy recovery devices are a good match for flow, pressure, salinity and tariff.
- Ask for the membrane replacement cost in dollars per year and dollars per 1,000 gallons.
No reverse osmosis desalination plant gets cheaper because of a reduction in one line item. Cost decreases when water quality, membrane selection, pump duty, filter loading, cleaning frequency, and brine outlet all move in concert. That’s the reason a consistent reverse osmosis membrane is so important in water purification systems where water supplies should remain steady. Public project teams should still compare the operating worksheet against TWDB desalination facts before pushing recovery or cutting pretreatment scope.
Buyer Checklist Before Asking for a BWRO Cost Quote
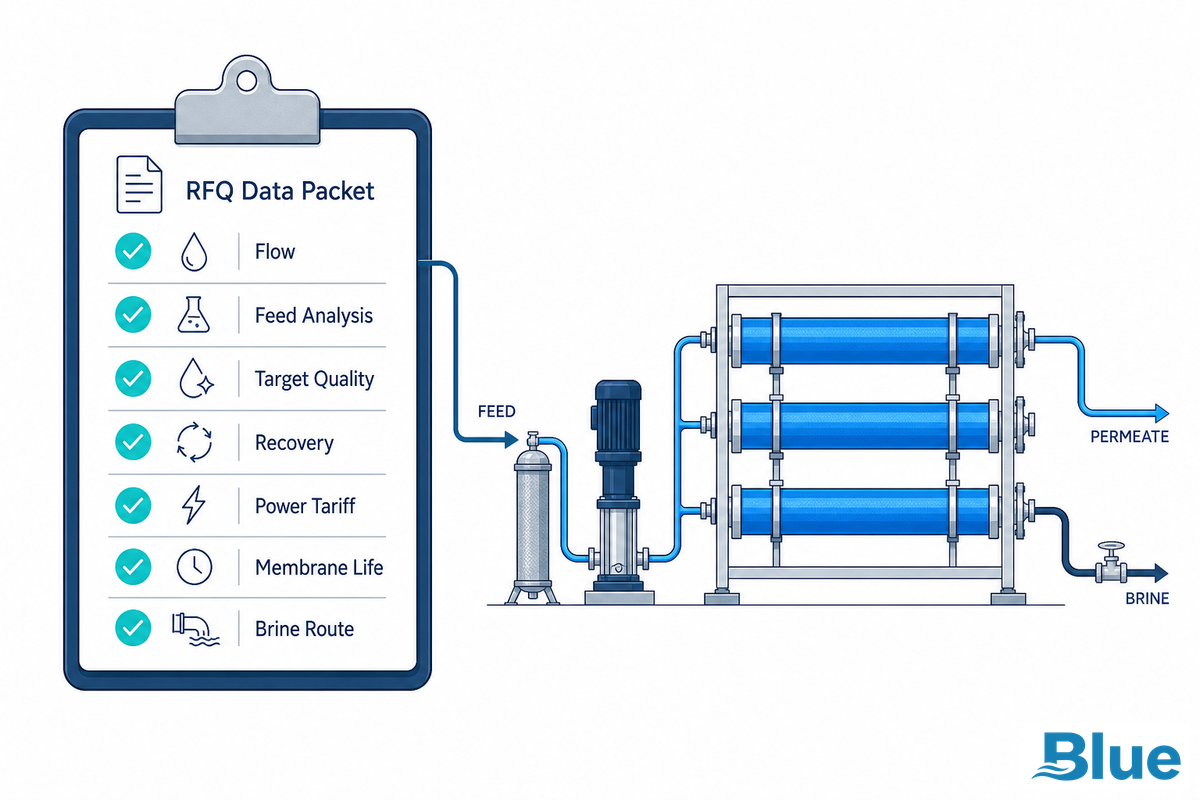
Before you can get an estimate for the brackish water reverse osmosis system cost or industrial reverse osmosis system cost, gather the information below. Without it, your quote can be nothing more than a very broad, system-type-based guess. TWDB’s brackish groundwater materials help illustrate why planning estimates improve as site-specific data arrives (TWDB cost-estimating report).
- Flow rate in gallons per day and hours of operation per day.
- Feed TDS, complete ion profile, pH, alkalinity, silica, sulfate, calcium, barium, iron, manganese, boron, TOC and temperature.
- SDI, turbidity, suspended solids, and biological fouling indicators.
- Target product water conductivity, rejection, and final water use.
- Recovery target, feed-to-product accounting, and concentrate flow.
- Electricity tariff, pump efficiency, and any time-of-use pricing.
- Chemical program used for pretreatment, antiscalant, dechlorination, pH control and CIP.
- Filter replacement rate and cartridge or media cost.
- membrane set, element size, target element lifetime and spare element strategy.
- Labor model, alarms, instrumentation, service visits, and remote monitoring.
- Concentrate disposal pathway, permitting status, discharge limits and contract, or hauling arrangements.
- Non-OPEX Capital cost elements including tanks, wells, piping, controls and commissioning.
Send this packet to Blue Membrane for a membrane fit review for brackish water RO, low pressure RO, seawater reverse osmosis or a mixed water treatment project. While Blue Membrane can advise on membrane selection logic, it’s up to the system builder to price skid scope, pumps, controls, pretreatment and local disposal.
FAQ
How much does BWRO cost per 1,000 gallons?
Published BWRO operating expense data generally comes out at around $1.48-$2.50 per 1,000 U.S. gallons based on $0.39-$0.66 per cubic meter pricing (which isn’t adjusted for inflation). Consider that figure a plant-side OPEX benchmark at best; it’s not the delivered water price, not total cost, and not a guarantee for your particular feed water. If your estimate uses example local tariffs such as $0.08, $0.12 or $0.18 per kWh, the energy line can move quickly. Feed water quality, recovery, membrane replacement, chemicals, filter changes, labor and concentrate disposal move the final number further still.
Is brackish water reverse osmosis cheaper than seawater RO?
Yes, most of the time at the membrane-train level, as brackish feed pressure requirements are lower than for seawater. But in land disposal or fouling may erode much of that benefit. A brackish groundwater plant with a challenging concentrate discharge may prove more expensive than a simpler coastal plant once the disposal, permitting and cleaning cost is accounted for.
What is the biggest BWRO operating cost?
No single biggest cost line applies to every brackish RO system. Energy is readily seen as pressure, pump and energy use affect the meter every day. A 0.70 kWh/m3 plant and a 1.40 kWh/m3 plant won’t yield the same electrical cost. Inland, concentrate disposal often becomes the dominating cost line. Smaller plants may be dominated by membrane replacement, cartridge filters, labor, and service trips because the same amount of fixed work is distributed among fewer gallons.
How do membranes affect BWRO operating cost?
Membranes dictate pressure, rejection, permeability, cleaning frequency and replacement intervals. Stable brackish water RO membrane performance will allow product water quality and energy costs to be predictable.Think about the membrane replacement as dollars per 1,000 gallons not just a cost per element.
What data is needed to estimate BWRO operating expenses?
Gather your gallons per day, hours of operation, feed TDS, complete water analysis, SDI, turbidity, temperature, desired product water quality, target recovery, electrical rate, pump assumptions, chemicals, filter replacement rate, membrane cost set, expected element life, labor model, cleaning strategy, and concentrate disposal method. Add operating pressure bands (150, 250 or 400 psi), planned recovery rates (70, 80 or 85 percent), and service assumptions for the membrane replacement (2, 3 or 5 years). A cost per gallon without these details is only a planning range.
References
- FGCU Scholars Commons: BWRO economics and energy consumption
- Texas Water Development Board: Cost of brackish Groundwater Desalination in Texas
- Texas Water Development Board: Desalination facts
- Science of The Total Environment: BWRO SEC operating parameters
- Desalination and Water Treatment: BWRO energy recovery retrofit
- Journal of Hazardous Materials Advances: RO membrane fouling review
- U.S. EPA: NPDES permits
- Water Online: RO recovery rates and concentration factors
- Google Patents: pressure-driven membrane liquid separation