Get in touch with Blue Membrane Company

Reverse Osmosis Technical Guide
RO membrane salt rejection is the percentage of dissolved salt an RO membrane keeps out of the permeate, but the number only means something when the test basis, feedwater, recovery, and operating pressure are clear.
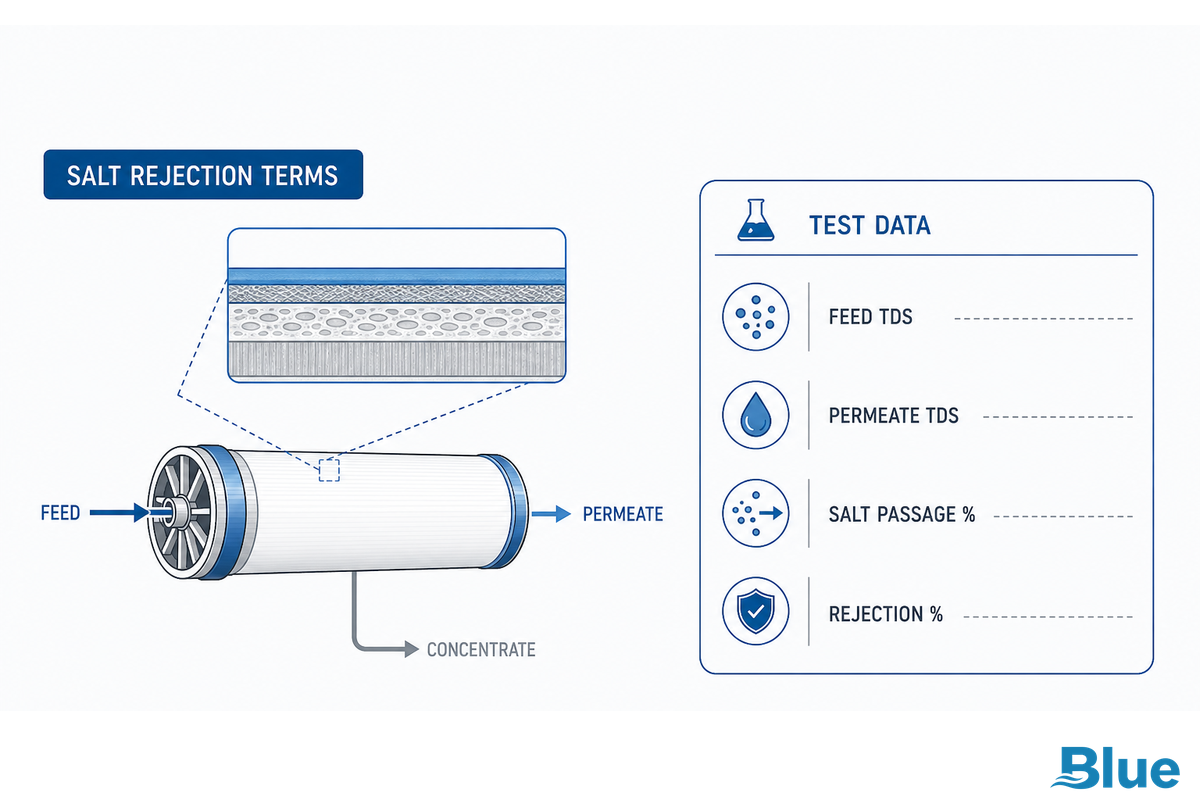
Quick Specs: Salt Rejection Terms Engineers Check First
Main value
Salt rejection, shown as % rejection
Inverse value
Salt passage, shown as % passage
Common test salt
NaCl in controlled feed water
Field risk
Catalog % changes when feed and recovery change
Reverse osmosis datasheets may show 99.5%, 99.6%, or 99.8% salt rejection. Those values are useful, but only after you ask a second question: rejection under which feed concentration, pressure, temperature, recovery, and membrane condition?
System designers, OEM partners, and plant teams have a more practical job than chasing the highest printed percentage. Their job is matching the membrane element to a feedwater window where permeate quality, energy use, recovery, and element life can all hold together.
Quick Answer: What RO Membrane Salt Rejection Means
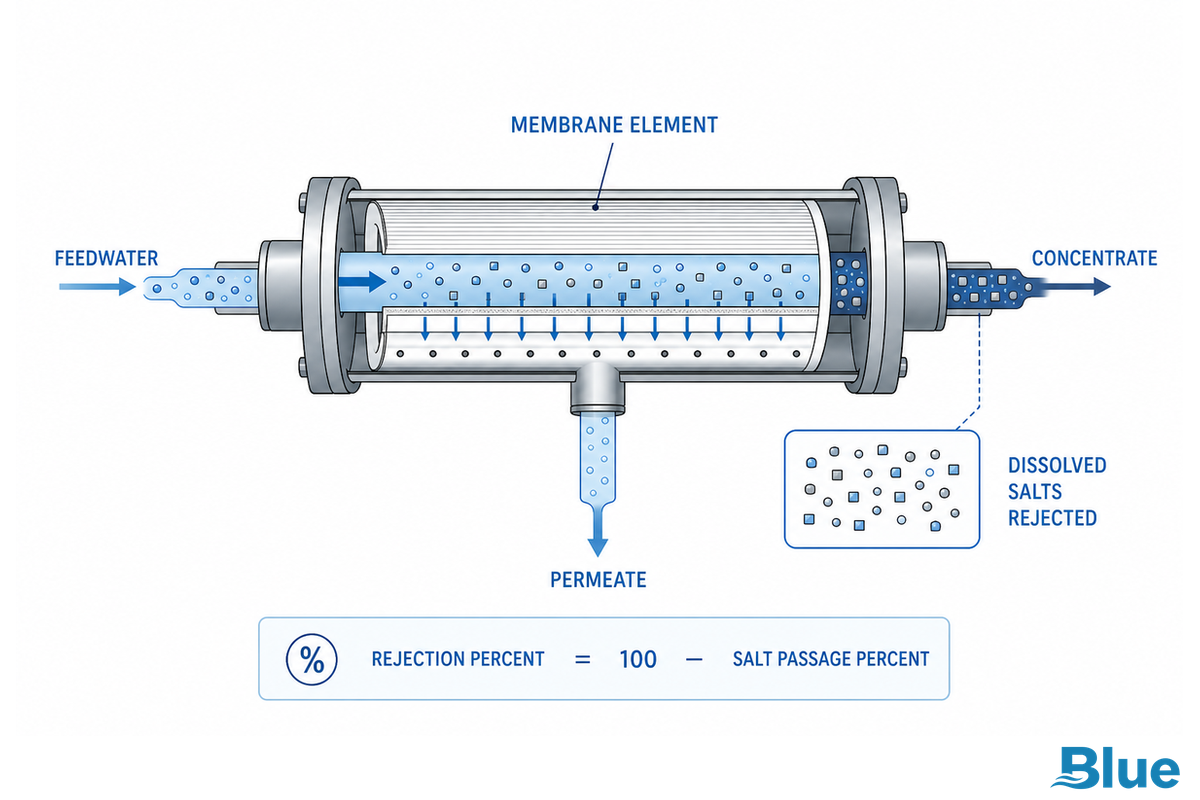
Salt rejection is the percentage of dissolved salts that an RO membrane keeps from passing into the permeate stream.
If less salt reaches the permeate, rejection is higher; if more salt reaches the permeate, salt passage is higher.
One-minute answer
- Salt rejection measures what the membrane holds back.
- Salt passage measures what gets through.
- Permeate TDS is the field number most operators watch.
- The same membrane can show a different rejection rate when pressure, temperature, recovery, or feed concentration changes.
That last point is where buyers get trapped. A membrane element with a strong stabilized rejection rating can still miss the permeate target if it is selected for the wrong feed TDS, run close to osmotic-pressure limits, or placed behind weak pretreatment. For a baseline explanation of the element itself, see Blue Membrane’s article on what an RO membrane is.
In practice, salt rejection is a performance measurement, not a universal promise independent of operating conditions.
Salt Passage vs Salt Rejection: Two Views of the Same Test
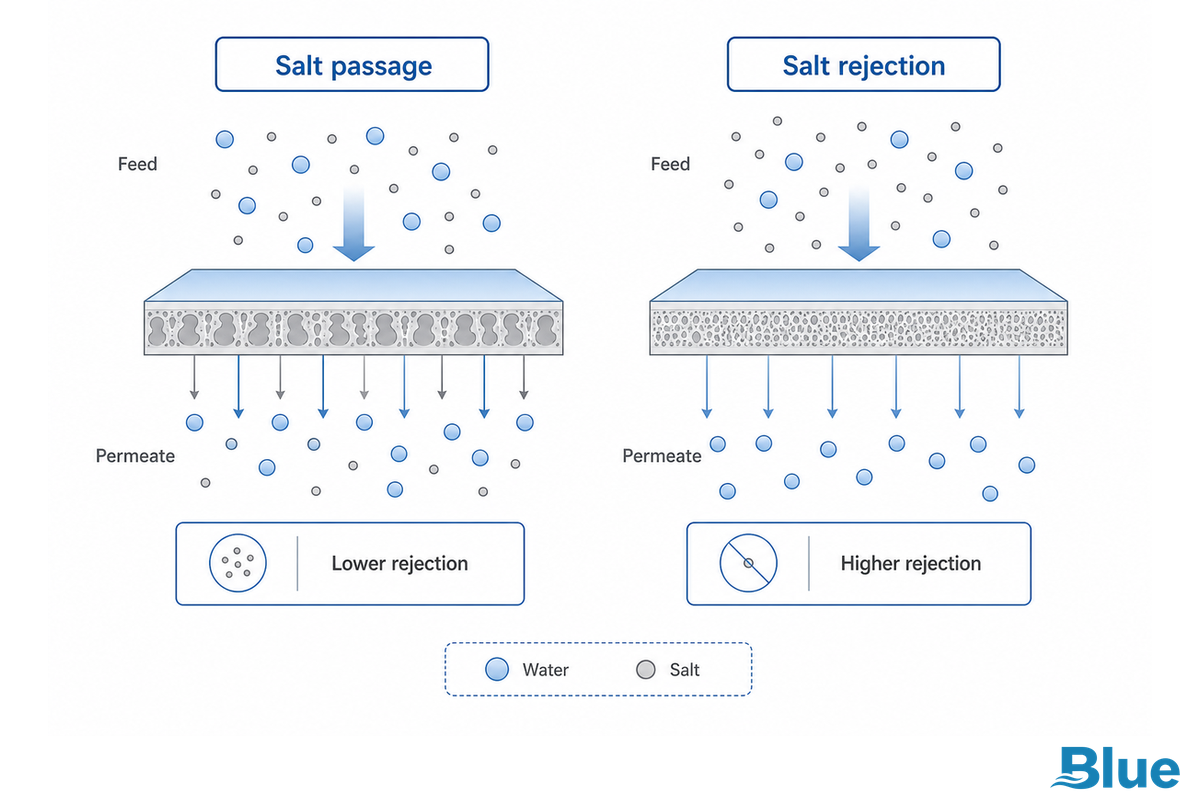
Salt passage and salt rejection describe the same membrane event from opposite sides. The American Membrane Technology Association explains that compounds found in the permeate are counted as passage, while compounds held on the concentrate side are counted as rejected.
Salt passage
Salt Passage % = (Cp / Cf) x 100
Cp = permeate TDS.
Cf = feedwater TDS or calculated average feed TDS, depending on the system calculation.
Salt rejection
Salt Rejection % = (1 – Salt Passage) x 100
Lower salt passage means higher salt rejection.
One simple bench check may use feed TDS. In a pressure vessel with several elements in series, the back-end element sees a more concentrated stream than the first element.
That is why average feed concentration matters.
Engineering Note: average feed TDS
AMTA gives a 50% recovery example where 1,000 ppm feedwater exits the last membrane at 2,000 ppm concentrate. The calculated average feed TDS is 1,500 ppm, and AMTA’s example then gives 0.66% salt passage and 99.34% salt rejection.
Takeaway: do not compare two rejection percentages unless the denominator and recovery basis match.
How to Calculate RO Rejection Rate Without Fooling Yourself
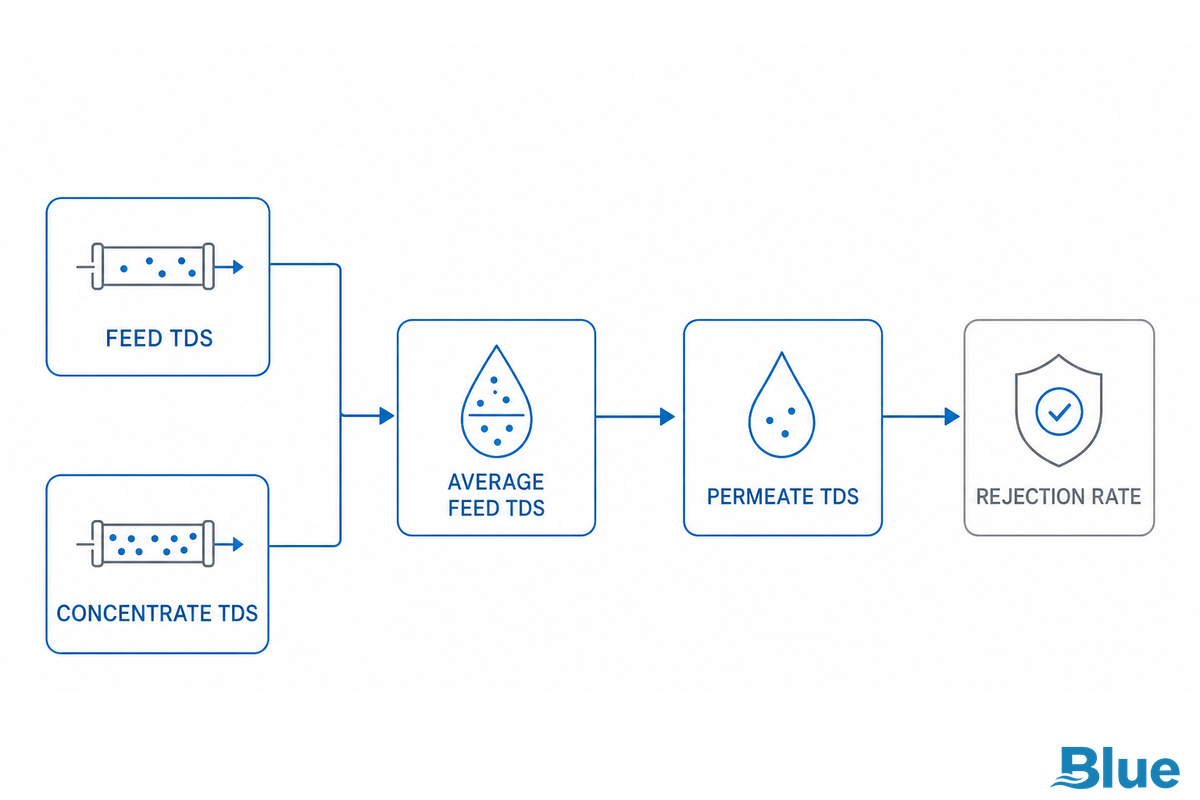
This rejection rate calculator is only as good as the readings you put into it. Each calculation should name the feed sample point, permeate sample point, recovery, and whether feed TDS is raw feed or average feed concentration.
| Step | Value to record | Why it matters |
|---|---|---|
| 1 | Feed TDS or average feed TDS | This is the denominator in the salt passage calculation. |
| 2 | Permeate TDS | This is the dissolved salt that passed into product water. |
| 3 | Recovery % | Higher recovery concentrates salts on the concentrate side. |
| 4 | Temperature and pressure | These change flow and can change apparent rejection. |
Example: if average feed TDS is 1,500 ppm and permeate TDS is 10 ppm, salt passage is 10 / 1,500 x 100 = 0.66%. Salt rejection is (1 – 0.0066) x 100 = 99.34%.
In the field, get the numbers before you interpret the percentage. A handheld TDS meter reading after a tank, after blending or before temperature stabilization may make a healthy membrane look weak. Plant teams also should compare the same sample points over time; don’t mix startup lab values with later tank readings.
Takeaway: record sample points and recovery with the rejection calculation, or the percentage may send the team in the wrong direction.
Why Test Conditions Change the Rejection Percentage
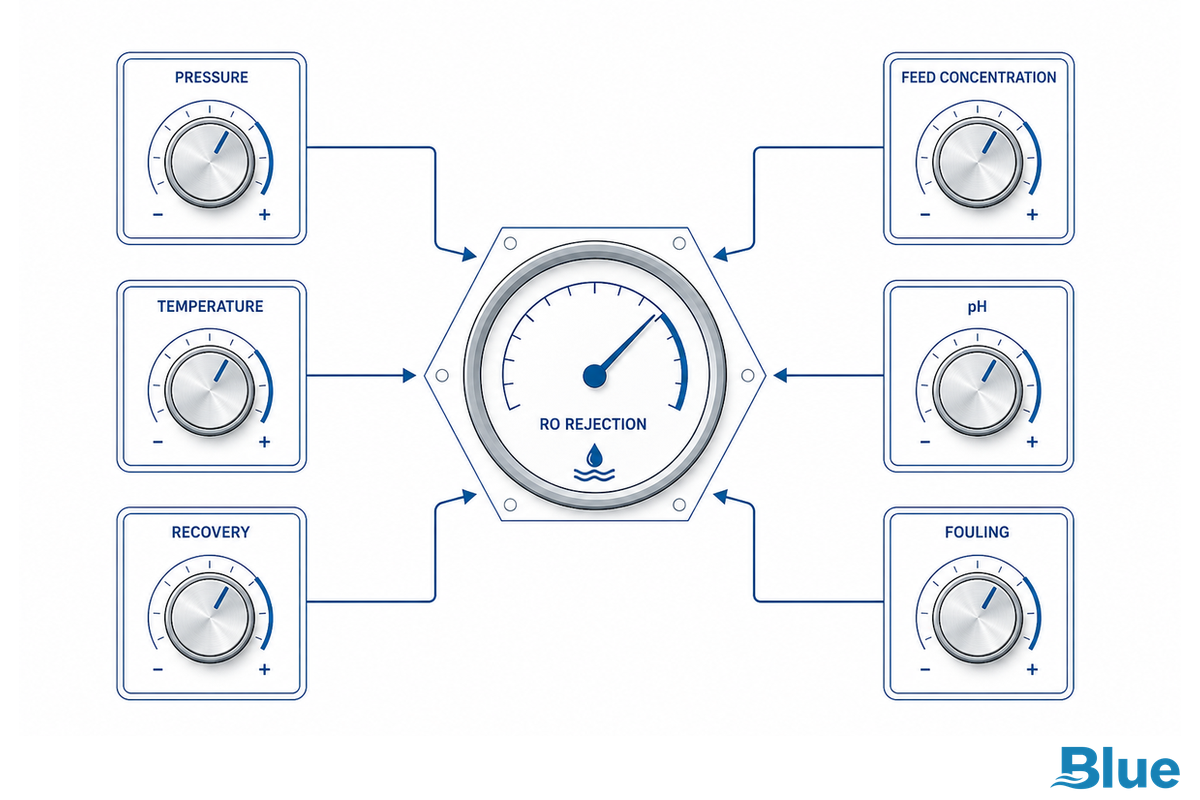
RO membrane performance depends on operating conditions, so the same element can show a different rejection percentage when the test basis changes. Water Quality Association guidance names feed concentration, feed temperature, operating pressure, and recovery as four main factors that affect RO membrane performance, with pH and ion type also influencing the result.
| Variable | What changes | Buyer question |
|---|---|---|
| Feed concentration | Higher TDS raises osmotic pressure and can lower permeate flow and rejection if pressure is unchanged. | What is the worst-case feed TDS, not just average TDS? |
| Operating pressure | More net driving pressure can raise permeate flow, but the element still has pressure and fouling limits. | Is the pump sized for the target flux and pressure vessel count? |
| Temperature | Warmer feed tends to increase permeate flow and salt passage; colder feed lowers flow. | Are winter and summer readings being compared at the same basis? |
| Recovery | Higher recovery concentrates the reject stream and raises scaling pressure. | Is recovery being pushed higher than the feed chemistry allows? |
| pH and ion mix | Membrane charge and ion behavior can change with water chemistry. | Are pH, silica, hardness, and scaling ions in the water analysis? |
Open Membrane Database guidance makes the same point from a test-reporting view: membrane performance depends on pH, salt concentration, applied hydraulic pressure, and concentration polarization, so reported performance should be compared with attention to test conditions.
ASTM D4516 is relevant because it covers standardizing permeate flow and salt passage data for RO systems when pressure, temperature, conversion, and feed concentration vary. That does not turn field data into a perfect prediction, but it gives operators a reason to track normalized trends instead of isolated readings.
Operating basis: a rejection percentage without test conditions is a partial number. Ask for the operating basis.
What Is a Good Salt Rejection Rate for an RO Membrane?
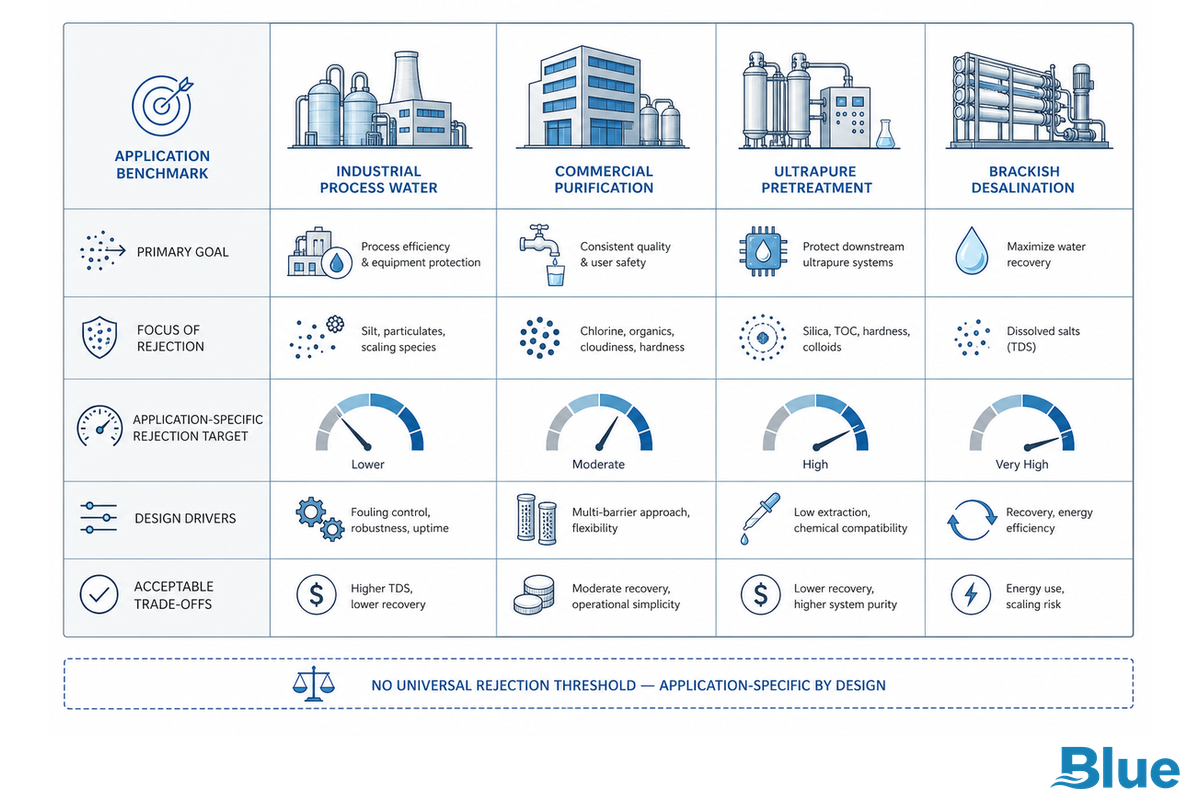
Good rejection means meeting the permeate target at the required recovery and feedwater window, not winning a catalog-number comparison. Commercial polishing systems, ultrapure water pretreatment trains, brackish water RO skids, and wastewater reuse plants may all read the same percentage differently. For product-level context, compare the available RO membrane element families against the actual feedwater duty.
| Application | What the rejection rate must protect | Selection implication |
|---|---|---|
| Commercial purification | Consistent product-water taste, scaling control, and cartridge life | Low-pressure elements may fit when feed TDS is stable and modest. |
| Industrial process water | Downstream process tolerance, rinse quality, and boiler or cooling-loop chemistry | Confirm target permeate TDS and cleaning plan before choosing energy savings over margin. |
| Ultrapure water pretreatment | Load on mixed bed, EDI, UV, or polishing stages | Rejection stability may matter more than first-pass flow alone. |
| Brackish or desalination projects | Osmotic pressure, concentrate handling, and recovery economics | Higher feed TDS often requires more pressure or a different membrane choice. |
If your project starts with element replacement, the first check is whether the installed model, housing and feed spacer match the duty. Blue’s RO membrane elements page and RO membrane compatibility cross-reference chart can help frame that replacement question before a technical review.
Takeaway: judge rejection by the water target and operating window, not by a single catalog value.
The 5-Variable Salt Rejection Window
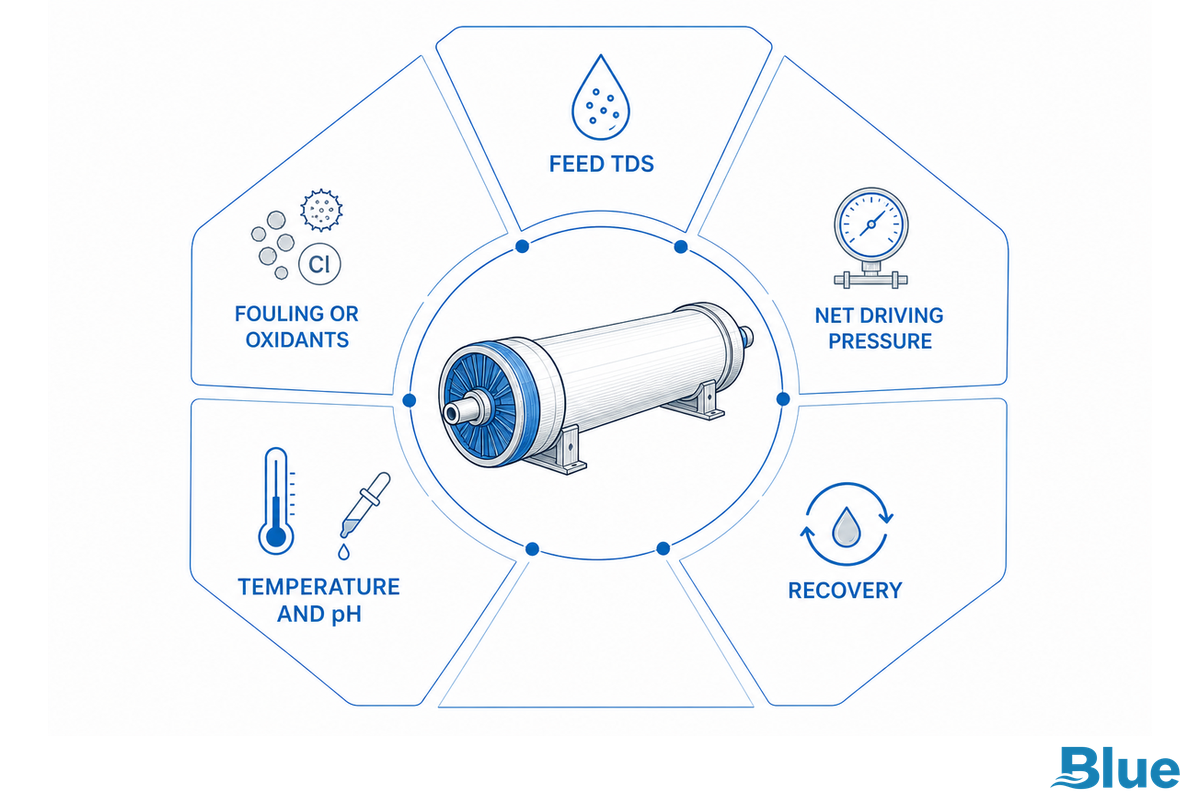
This 5-Variable Salt Rejection Window is a buyer check for comparing RO membrane claims. It turns a printed rejection value into five engineering questions that plant, QA and procurement teams can answer before purchase.
| Variable | What to send or verify | Risk if ignored |
|---|---|---|
| Feed TDS and ion mix | Worst-case TDS, sodium, chloride, hardness, silica, alkalinity | Membrane looks suitable on average water, then fails at seasonal peak. |
| Net driving pressure | Feed pressure, pressure loss, osmotic pressure, and pump limit | Energy savings disappear or permeate flow falls short. |
| Recovery target | Stage recovery, total recovery, concentrate management plan | Back-end concentration rises faster than expected. |
| Temperature and pH | Minimum and maximum feed temperature; continuous pH window | Winter flow, summer passage, and cleaning assumptions diverge. |
| Fouling and oxidant exposure | SDI15, turbidity, organics, iron, manganese, free chlorine | Good startup rejection is lost to preventable membrane damage or fouling. |
Procurement teams can use this table to compare quotes. Plant managers can use it to challenge whether the pump and pretreatment are matched to the selected element. QA leads can use it to define the acceptance readings after startup.
Decision rule: the window makes rejection a design decision instead of a catalog race.
How ULP RO Membranes Hold Rejection at Lower Pressure
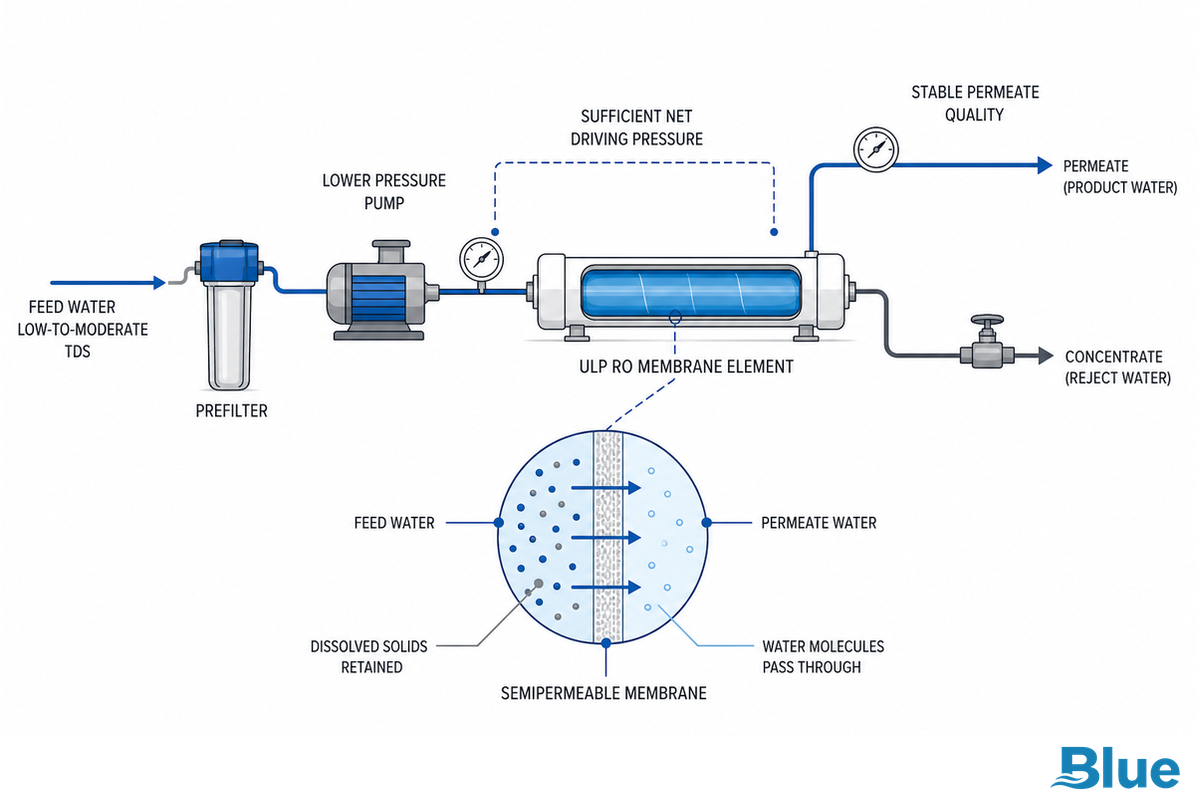
A low-pressure or ultra-low-pressure RO element is usually built around thin-film polyamide chemistry in a spiral-wound element format, with useful permeate flow at a lower applied pressure than a standard brackish-water element. That can reduce pump demand on low-TDS feedwater, but it does not remove the need for net driving pressure.
U.S. Department of Energy guidance explains the basic pressure logic of RO: saltier water requires more pressure to force water through the membrane, and very high salt content can move beyond what membranes can handle. That is the reason ULP selection starts with feed TDS, not just energy cost.
| Blue Membrane option | Test basis / rejection | Best-fit decision |
|---|---|---|
| C1 low-pressure / ULP series | 150 psi test basis; 99.5% stabilized salt rejection | Energy-led low-TDS municipal or commercial feed where the permeate target has some margin. |
| C2 low-pressure high-rejection series | 225 psi test basis; 99.6% stabilized salt rejection | Projects that still want a low-pressure class but need more rejection margin or see variable feed quality. |
| Available element sizes | 8040, 4040, 4021, and 2540 | Replacement, OEM, pilot, and compact system formats. |
On low-TDS feedwater, review Blue Membrane’s low-pressure ULP RO membrane elements when the project goal is lower feed pressure without losing the rejection class required by the permeate target.
Takeaway: ULP is most efficient when feed TDS is low enough that osmotic back-pressure does not erase the pressure benefit.
When Lower Pressure Is the Wrong Tradeoff
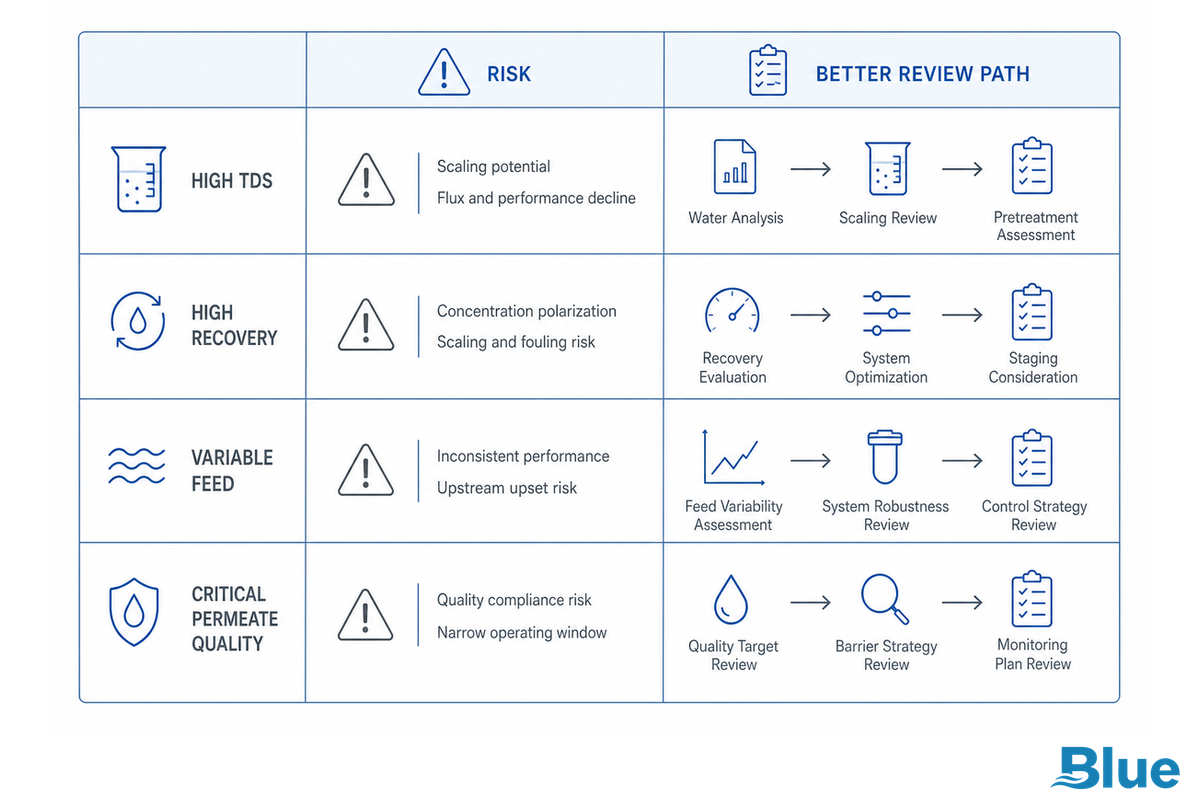
Lower pressure isn’t necessarily the best engineering option. Higher feed TDS, a push for higher recovery, and demand for higher quality permeate might suggest sticking with the safe choice: a standard RO element, higher rejection element, tight pretreatment, or even two passes.
Where ULP tends to fit
- Low-TDS municipal or tap feed.
- Stable feed chemistry with good pretreatment.
- Energy cost is a major operating concern.
- Permeate target allows a measured safety margin.
Where to pause
- High-TDS brackish or seawater-like feed.
- High recovery with scaling pressure.
- Critical permeate quality with no polishing stage.
- Variable feed from reuse or surface-water sources.
Bureau of Reclamation brackish groundwater work states the core tradeoff plainly: lower-pressure membrane choices can reduce energy, but lower salt rejection capability can change product-water risk. In RO projects, the pressure saving must be weighed against final permeate quality and the consequence of missing the target.
This is why the ideal early RFQ question isn’t “Which element is cheapest at lowest pressure?”. It is, “Which element is lowest cost for my highest-case feed TDS, recovery and temperature to achieve target permeate TDS?”.
Takeaway: lower pressure saves energy only when rejection and flow still have enough feedwater margin.
Why Salt Rejection Drops in the Field
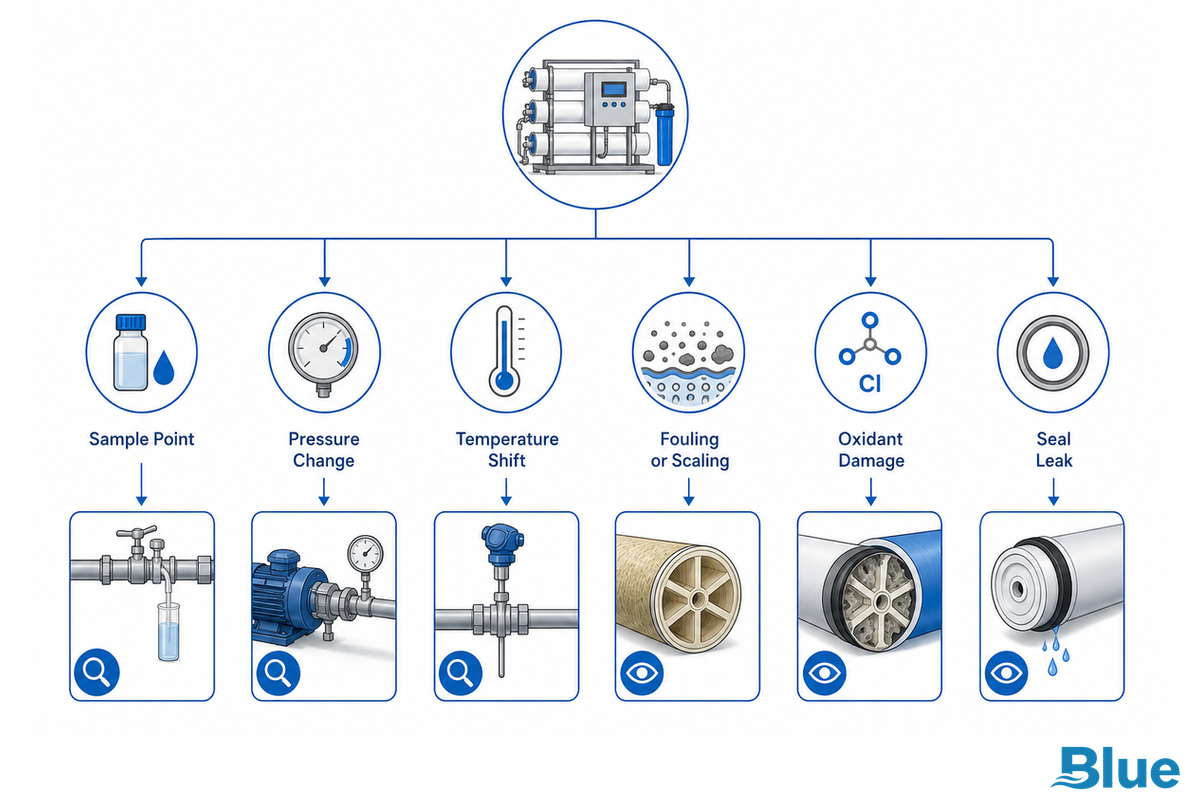
When measured rejection drops, do not replace the membrane element before isolating the failure pattern. Water Technology Online notes that lower percent rejection can point to a leaking O-ring, fouling, scaling, improper pH, high recovery, low feed pressure, or a changed feedwater source.
| 7-day check | What to compare | Likely next action |
|---|---|---|
| Permeate conductivity by vessel | System-wide, stage-specific, or one-vessel shift | Probe vessels before ordering replacement elements. |
| Pressure differential | Startup baseline versus current trend | Check fouling, scaling, spacer blockage, and cleaning timing. |
| Feed pressure and recovery | Actual readings versus design basis | Lower recovery or correct pump/valve issues before blaming the membrane. |
| SDI15, chlorine, and pretreatment logs | Daily feed trend versus element limit | Review cartridge, UF, antiscalant, carbon, or dechlorination control. |
| Recent chemistry changes | Source switch, cleaning, pH adjustment, or upstream process change | Normalize data before declaring element failure. |
When feedwater problems are suspected, start with Blue’s industrial RO pretreatment guide. If the pattern points toward end-of-life rather than feed control, use the RO membrane replacement guide to organize the element-change decision.
Takeaway: separate a rejection drop by vessel, stage, pressure, and feed chemistry before swapping elements.
Specification Checklist Before Choosing C1, C2, or a Standard RO Element
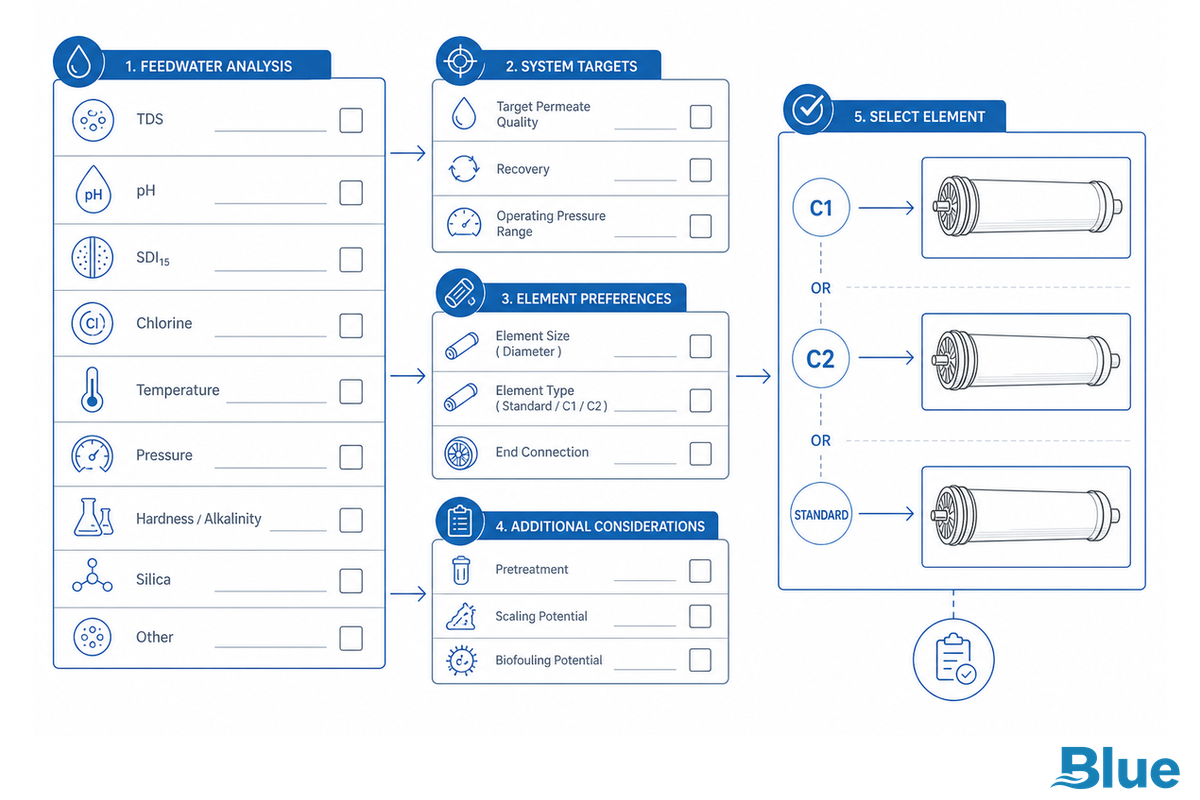
Good membrane questions get the supplier the data they need to discard a wrong option up front, avoiding plant time, finance review time, and startup risk.
Send these fields with the RFQ
- Feedwater source, full analysis, and worst-case TDS.
- Temperature range, pH range, SDI15, turbidity, iron, manganese, silica, and hardness.
- Free chlorine control and oxidant exposure history.
- Target permeate TDS, flow, recovery, and pass count.
- Available feed pressure, pump limit, vessel configuration, and element size.
- Current installed model if this is a replacement.
- Pretreatment train, including cartridge rating, UF, antiscalant, carbon, or dechlorination.
Blue Membrane’s ULP page lists feed and use conditions such as target low-TDS service, SDI15 ≤ 5, free chlorine < 0.1 ppm, 5-micron cartridge filtration minimum, 45°C maximum temperature, and pH 3-10 continuous. Use those values as screening conditions, then confirm final design with your system data.
Low-pressure projects should ask for a C1/C2 fit review against feed TDS and target permeate quality. The easiest path is to use the Request a C1/C2 fit review popup and include feedwater data in the message.
RFQ rule: a short request with measured feedwater data beats a long email asking for the “best” membrane.
What Is Changing in Salt Rejection Specs and Low-Energy RO Design
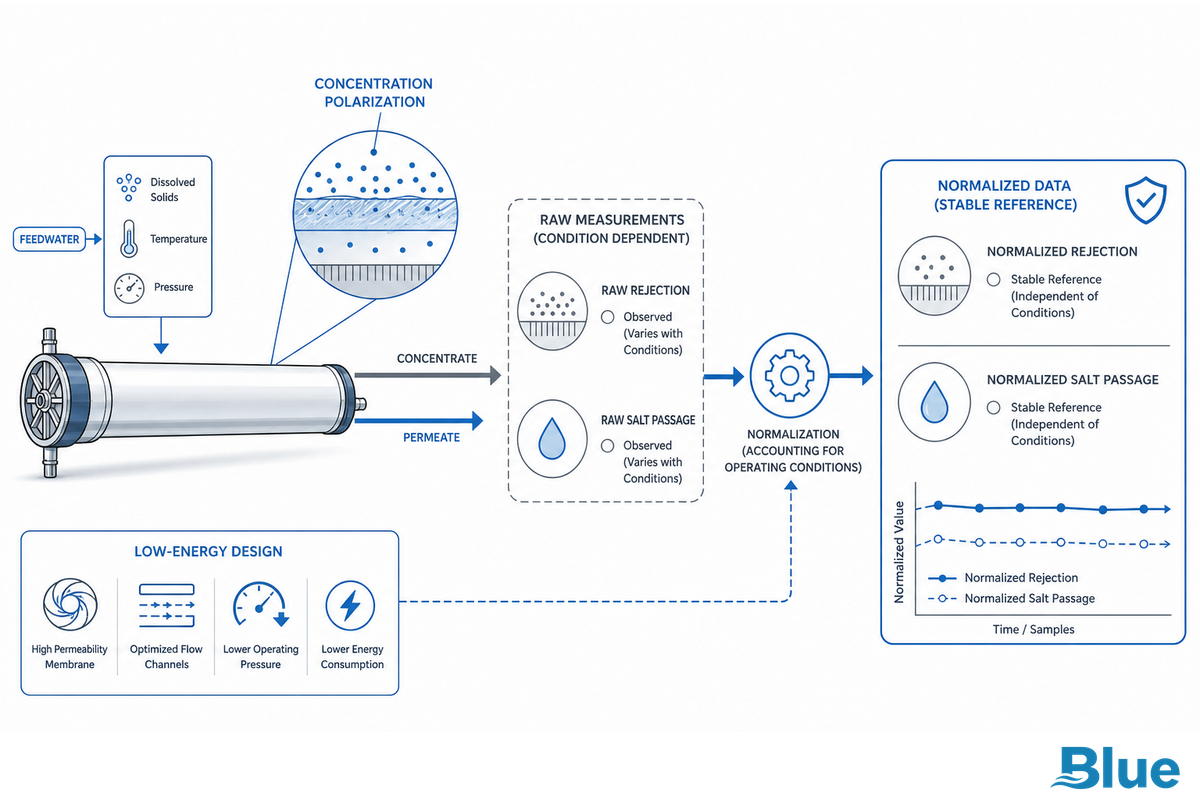
RO design is moving toward lower energy use, but buyers cannot give up permeate quality or membrane life. DOE’s desalination overview connects RO to pressurized membrane treatment and notes that saltier water requires more pressure, which is why energy and salinity stay tied together.
In 2026 projects, the practical shift is stricter use of normalized operating data. If a plant tracks salt passage, permeate flow, recovery, pressure differential, temperature, and feed TDS together, the team can separate membrane loss from normal seasonal shifts. ASTM D4516 and standard testing discussions point in that direction: compare RO performance at known conditions, not scattered readings.
Blue Membrane buyers can act on this by using low-pressure or ULP elements where the feedwater window supports them, then keeping a written basis for why C1, C2, or a standard element was selected. In energy-led projects, that written basis is what lets finance see pump savings without leaving QA to absorb permeate-quality risk.
Related design reading: if your project is pushing recovery, pair this article with the high-recovery BWRO design guide.
Takeaway: the next efficiency gains will come from better matching between membrane chemistry, feedwater, and standardized operational data, not just pressure.
FAQ
What is salt rejection in an RO membrane?
View Answer
Salt rejection is the percentage of dissolved salt kept out of the permeate. If salt passage is 1%, rejection is 99%.
How do you calculate RO membrane salt rejection?
View Answer
Calculate salt passage first: permeate TDS divided by feed TDS, multiplied by 100. Then calculate rejection as 100 minus salt passage, or use (1 – Salt Passage) x 100 when passage is expressed as a decimal.
What is the difference between salt rejection and salt passage?
View Answer
Salt passage is what gets through. Salt rejection is what stays out. They are inverse readings of the same membrane barrier result.
What is a good RO membrane rejection rate?
View Answer
A good rate depends on the feedwater and permeate target. For example, a low-TDS commercial purification system may care most about energy and stable taste, while ultrapure pretreatment may need more margin because downstream polishing capacity is expensive. A brackish-water project may need a higher-pressure element, a different recovery target, or a second pass if the feed chemistry leaves little safety margin. Check rejection against target permeate TDS, recovery, temperature, pretreatment quality, and worst-case feed, not a generic number.
Why is my RO membrane not reaching 99% rejection?
View Answer
Check the sample points first. Then compare feed TDS, permeate TDS, recovery, pressure, and temperature against the design basis. If the loss is isolated to one vessel, inspect seals or O-rings. If it is stage-wide, review fouling, scaling, pH, feed pressure, and pretreatment.
Does lower feed pressure reduce salt rejection?
View Answer
It can, especially when pressure drops close to the net driving pressure needed for the feedwater. A ULP membrane is made for a lower-pressure class, but it still needs enough pressure after osmotic back-pressure and system losses are considered.
Can a ULP RO membrane be used for high-TDS water?
View Answer
Sometimes, but high-TDS feed is where ULP needs the most caution. As feed TDS rises, osmotic pressure rises and the pressure advantage narrows. Ask for a fit review before using ULP as an energy shortcut on brackish or variable feedwater.
When should an RO membrane be replaced because of poor rejection?
View Answer
Replace after you confirm that poor rejection is not caused by sampling error, temperature change, pressure loss, fouling, scaling, oxidant damage, seal leakage, or a feedwater shift. Review vessel-by-vessel conductivity, pressure differential, pretreatment logs, cleaning history, and normalized startup data first. If the same loss remains after those checks, replacement is easier to justify and easier to specify correctly.
Send Feedwater Data for C1/C2 Element Selection
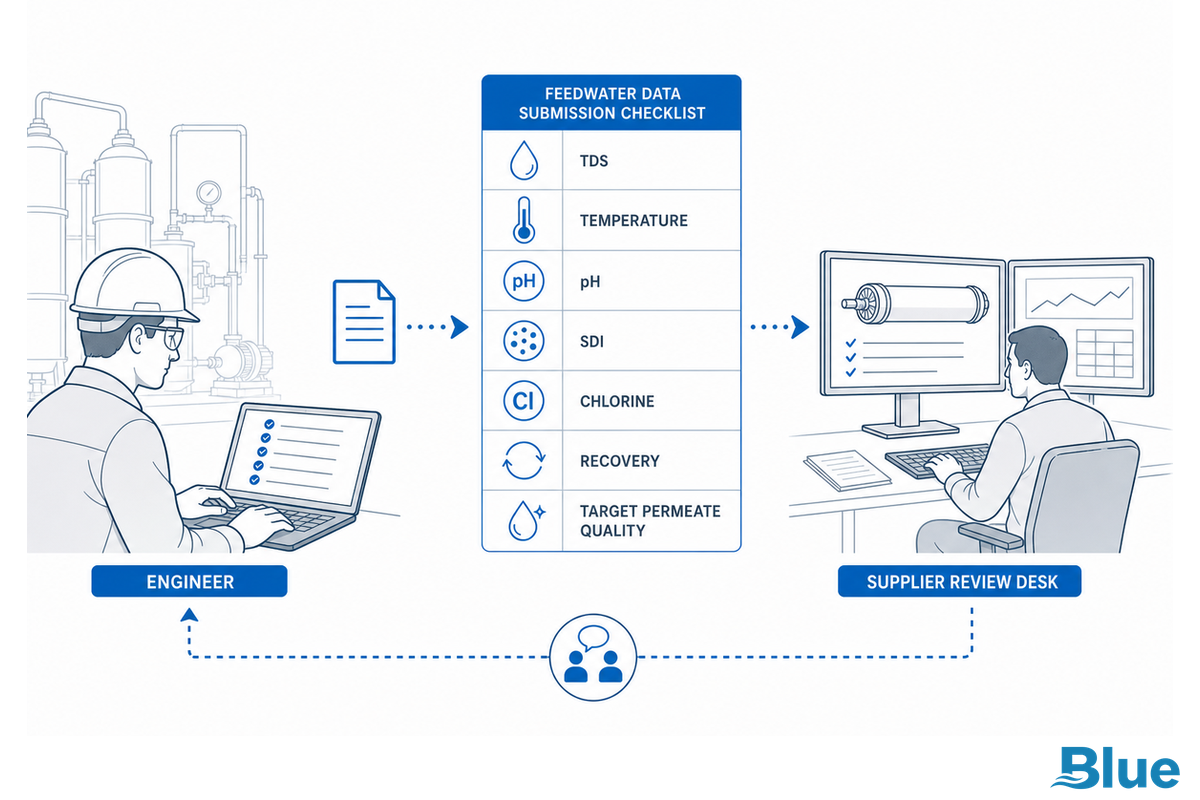
If your project involves considering low-pressure or ULP RO elements, please provide feed TDS, target permeate TDS, recovery, operating temperature range and current element size. Blue Membrane can assist in comparing C1, C2 and standard RO element selections for the intended operational conditions.
About This Technical Note
This article positions salt rejection as a design challenge rather than a mere definition. By incorporating association formulas, industry standards, publicly available membrane science references, and Blue Membrane’s documented ULP product data, buyers can craft more effective membrane inquiries.
References & Sources
- Understanding Salt Passage Vs. Salt Rejection In Reverse Osmosis Systems – American Membrane Technology Association
- Reverse Osmosis Technical Fact Sheet – Water Quality Association
- Membrane Performance Testing Standards – Open Membrane Database
- D4516 Standard Practice for Standardizing Reverse Osmosis Performance Data – ASTM International
- Desalination Basics – U.S. Department of Energy
- Treating Brackish Groundwater in Texas: A Comparison of Reverse Osmosis and Nanofiltration – U.S. Bureau of Reclamation
- 5 Key Performance Indicators in Reverse Osmosis Operation – Water Technology Online
Related Articles
- Industrial RO pretreatment guide – protect salt rejection before the membrane sees the feed.
- RO membrane replacement guide – decide whether rejection loss means replacement.
- High-recovery BWRO design guide – review recovery, concentration, and scaling pressure.
- C1/C2 low-pressure RO membrane elements – compare ULP options for low-TDS feedwater.
- Contact Blue Membrane – discuss feedwater and element selection.