Get in touch with Blue Membrane Company

Industrial RO troubleshooting guide · Updated October 2026
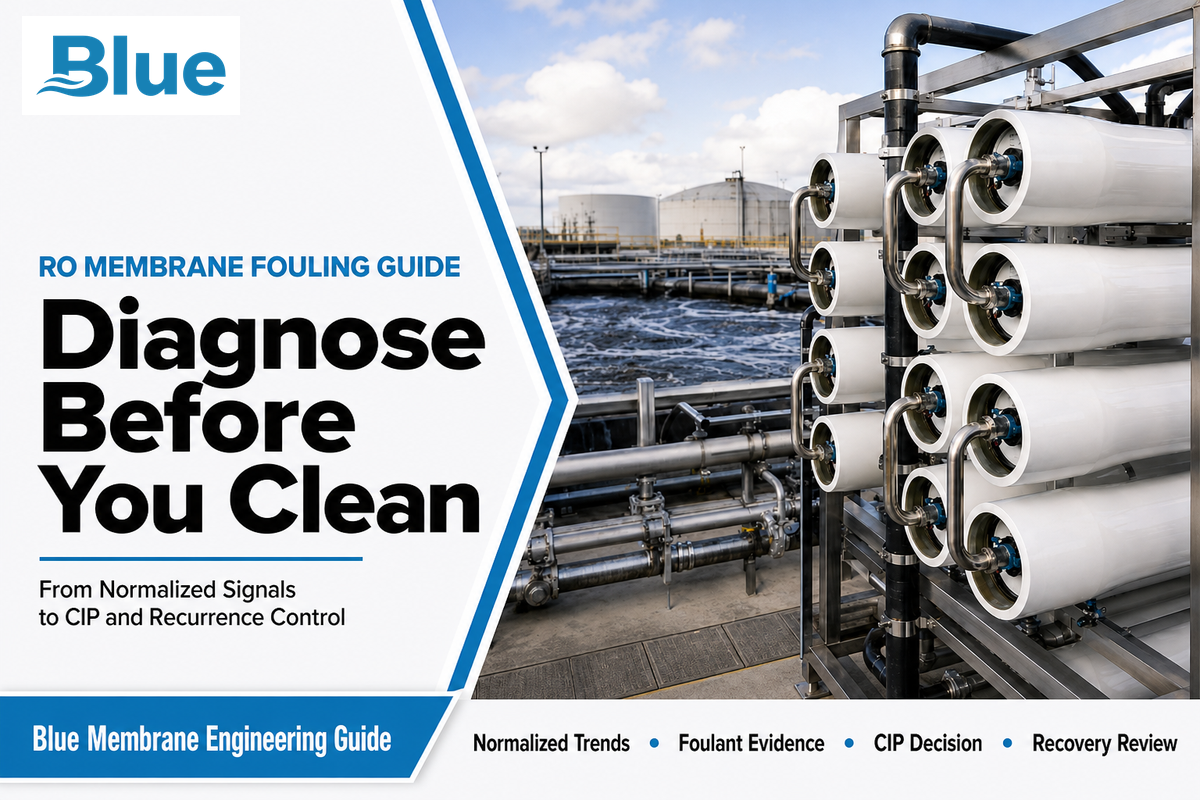
For fouling in RO, whether the issue is fouling of reverse osmosis membranes or fouling in seawater desalination, a membrane-level method can separate a real fouling trend from operating noise, select cleaning chemistry from evidence, and check whether the root cause was corrected.
RO membrane fouling is a performance problem caused by mineral scale, suspended or colloidal matter, organics, micro-organisms, or a combination of these in a deposit. It’s diagnosed by comparing normalized permeate flow, normalized salt passage and stage pressure drop with a stable clean baseline. It’s advisable to confirm the likely deposit before selecting a clean-in-place (CIP) program.
TL;DR
Do not choose a cleaner from one pressure or conductivity reading. Normalize the operating data, locate the change by stage and vessel, test the leading foulant hypothesis, clean within the exact element supplier’s limits, and compare post-CIP performance on the same operating basis. Hydraulic recovery, deposit removal, and recurrence prevention are three separate outcomes.
This document covers the majority of diagnosis and maintenance decisions. For questions regarding models, specifications, configurations, price, lead time, and quotes, please go to Blue Membrane’s fouling-resistant RO membrane element page. Broader feed-risk and pretreatment design issues should be addressed in the brackish-water RO fouling-control guide.
What RO Membrane Fouling Actually Changes
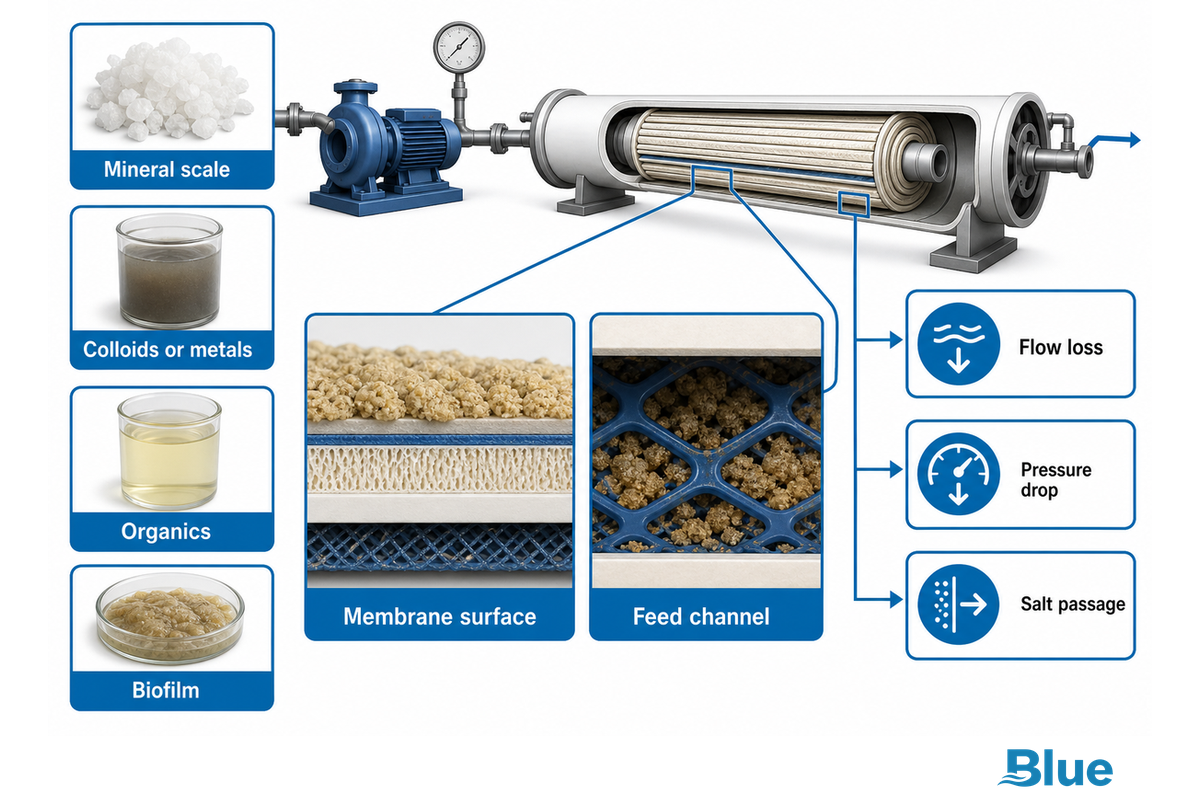
In fouling and scaling, including cases described as scaling and fouling, material accumulates onto the membrane surface while fouling restricts passage at the membrane surface or obstructs the feed channel. The plant may require more feed pressure to hold output. The deposit may reduce normalized permeate flow. It may also result in a higher feed-to-concentrate pressure drop or pass more salt. The effect depends on the deposit, its location, the plant’s operating conditions, and the extent of the problem.
Among pressure-driven membrane processes used for water desalination, ultrafiltration and reverse osmosis serve different separation roles, while reverse osmosis (RO) is a pressure-driven membrane filtration process used in drinking-water production, wastewater treatment, ultrapure water systems, and brackish water or seawater desalination. Different water sources contain various organic and inorganic foulants. As a fouling layer builds on the membrane surface or in the feed spacer, membrane permeability falls and the RO system may need more pressure, increasing energy consumption as material accumulates along the membrane surface and near membrane pores in areas prone to fouling.
Those symptoms can be caused by other problems. Salt passage can be caused by oxidation or other forms of chemical attack. Compaction can also reduce flow. Permeate quality can be impaired by damaged seals, O-rings and interconnects. A membrane can appear fouled due to a closed valve, a bad gauge, a changed recovery, a shift in temperature, or a higher feed salinity. Raw values don’t always tell the complete story. So, raw values alone can’t be used for diagnosis.
Four broad types of membrane fouling are useful for screening: mineral scale, colloids or metals, organics, and biofilm. Organic fouling may include natural organic matter, dissolved organic matter, organic matter and humic material. Colloidal fouling may include fine particles or metal carryover, with consequences for membrane lifetime. RO membrane biofouling may include microorganisms and extracellular polymeric substances—polysaccharide-rich material—while organic substances can feed growth and pretreatment can help reduce biofouling. Real deposits often overlap, so the diagnosis remains provisional until operating records and physical or analytical evidence agree.
Three-Signal Fouling Diagnosis Grid: Normalize Before You Blame the Membrane
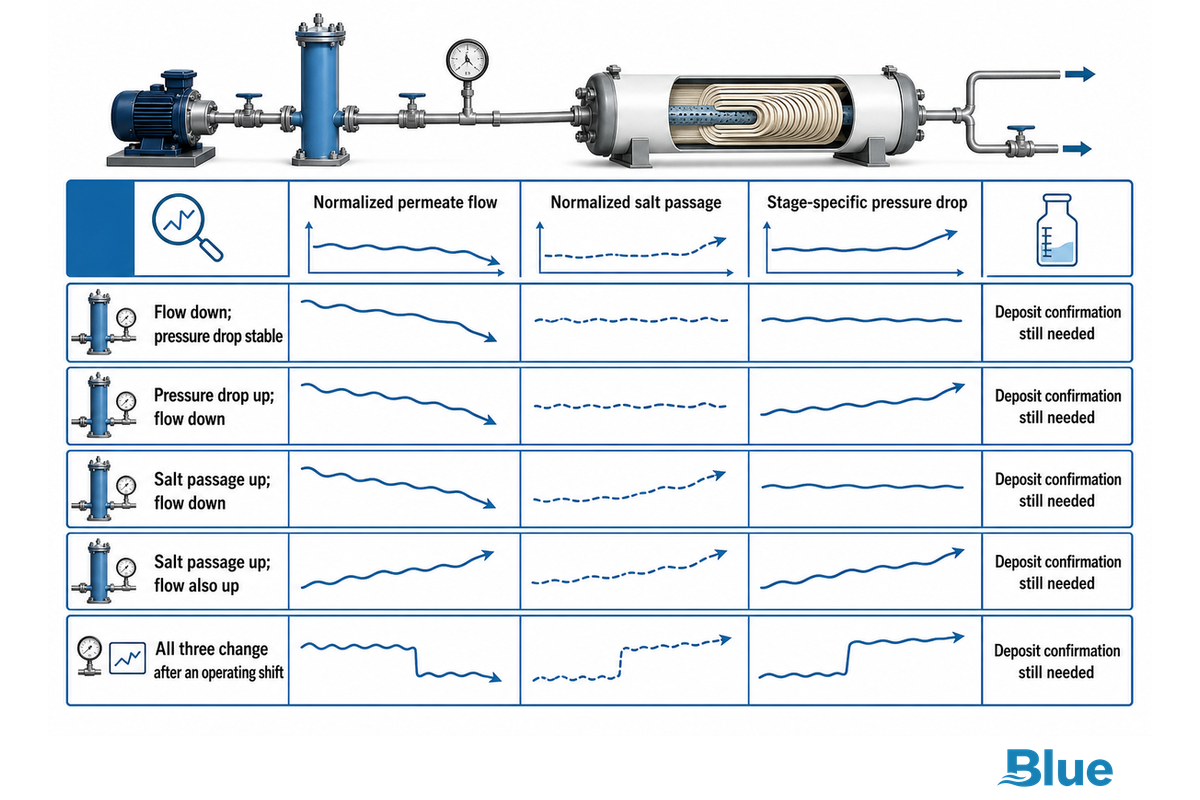
Direct answer: Compare normalized permeate flow, normalized salt passage, and stage-specific pressure drop to a stable clean baseline. Normalization accounts for the effects of operating variables like temperature, feed salinity, pressure and recovery. The three signals form a screening pattern, and on their own don’t point to a specific deposit.
| Observed pattern | What it may indicate | Check before acting | Confidence boundary |
|---|---|---|---|
| Flow down; pressure drop stable | Surface resistance, scale, organics, compaction | Temperature, feed salinity, net driving pressure, calibration | Does not identify foulant |
| Pressure drop up; flow down | Feed-channel blockage or heavy deposition | Stage location, valve position, spacer obstruction, instrument range | Signal location may differ from deposit origin |
| Salt passage up; flow down | Severe fouling, concentration polarization, scale | Feed conductivity, recovery, sampling point, element limits | Deposit confirmation still needed |
| Salt passage up; flow also up | Damage, seal leakage, oxidant exposure | Probe vessel, inspect seals, review chemical exposure | Do not assume a cleanable deposit |
| All three change after an operating shift | Operating-point or instrument effect | Recovery, backpressure, temperature, dose and calibration | Re-establish a comparable basis first |
Element suppliers provide relative cleaning triggers. The FilmTec Technical Manual, Version 20 (August 2026) states changes like a 10% decline in normalized permeate flow, a 5-10% rise in normalized salt passage, and a 10-15% increase in normalized pressure drop. Remember these changes are supplier-specific suggestions and aren’t absolute laws. For the suggested changes for your unit, use the current manual.
Hydranautics TSB107 lists typical screening values of a 10% normalized permeate-flow decline, a 10% normalized permeate-quality change, or a 15% normalized pressure-drop rise. A 1 bar raw pressure change still means little without the associated flow and operating basis. Thresholds from either supplier belong only to the applicable element and its current documentation; their interpretation depends on the application of RO.
A 10% raw-flow change isn’t interchangeable with a 10% normalized-flow change. Record both, but use the normalized value for trend decisions and keep the raw value for checking the operating point.
Verify first
- Instrument calibration and sampling points
- Temperature, salinity, pressure and recovery
- Permeate backpressure and valve positions
- Stage and vessel consistency
Do not infer
- Deposit type from differential pressure alone
- Cleaning need from calendar time alone
- Permanent damage from one poor reading
- Root cause from the first visible symptom
Foulant Fingerprint Matrix: Scale, Colloids, Organics, and Biofilm
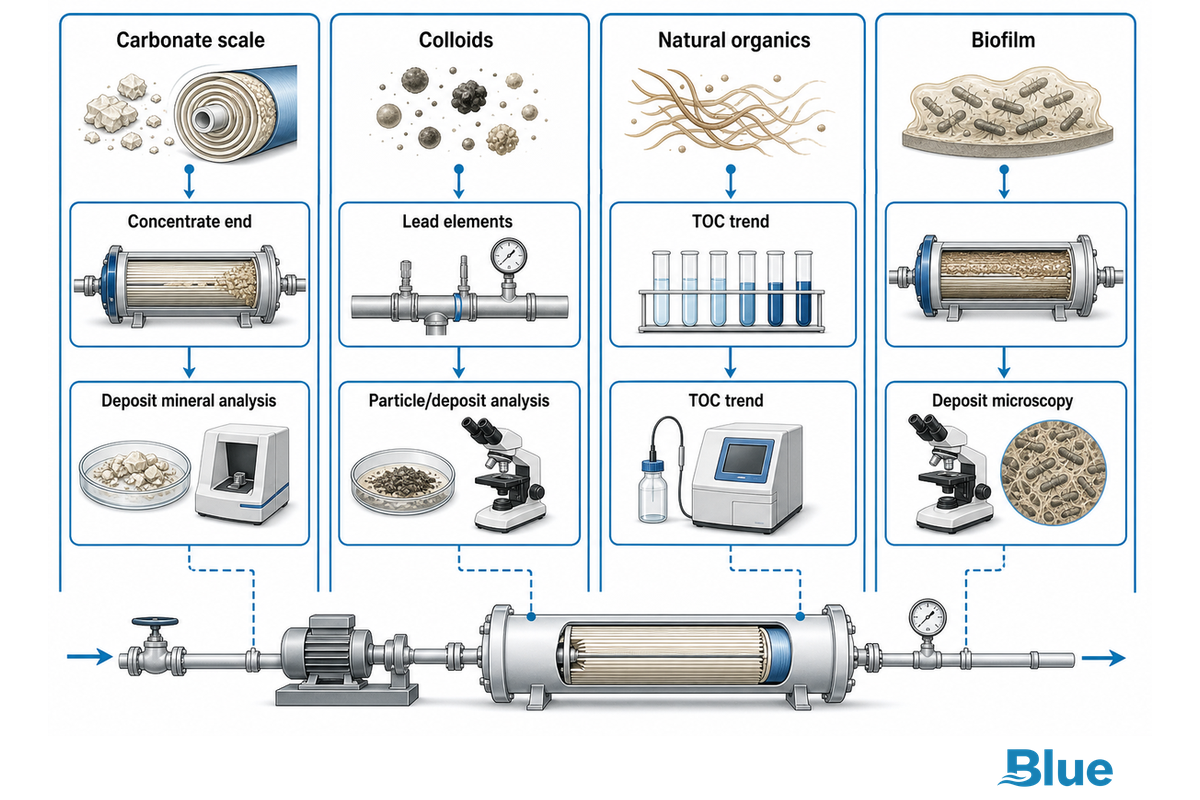
4-Part Foulant Fingerprint Matrix
The table below demonstrates how screening and escalation work, and isn’t a causal classifier. Array location matters, but water moves downstream. An obstruction in the lead means that flows and hydraulics may change later on, and conditions in the tail may affect overall system output. Use array location, time order, feed-water history, and deposit evidence together.
| Foulant type | Likely location or trend | Feed or pretreatment clue | Useful confirmation | Cleaning direction | Key uncertainty |
|---|---|---|---|---|---|
| Carbonate scale | Often concentrate end; flow loss and salt passage may rise | Higher recovery, pH or hardness; antiscalant interruption | Saturation review, deposit mineral analysis | Supplier-approved acidic system may apply | Other minerals may coexist |
| Sulphate or other scale | Often later stages; recovery can be poor | Concentrate exceeds solubility margin | Full ion balance, XRD or SEM–EDS | Exact mineral controls chemistry | Some deposits are difficult to remove |
| Silica-rich deposit | Concentrate end tendency; gradual flow decline | Silica concentration, pH and recovery history | Silica test plus deposit analysis | Specialist supplier procedure | Mineral and colloidal silica behave differently |
| Colloids | Often lead elements; pressure drop can rise | Turbidity or SDI excursion; filter breakthrough | Cartridge inspection, filter paper, particle/deposit analysis | Often alkaline or dispersant route | Metals and organics can bind particles |
| Iron or aluminium carryover | Lead-end deposition is common | Coagulant carryover, corrosion or upstream upset | Dissolved/total metals and deposit analysis | Chemistry depends on metal form and co-foulants | Colour is not proof of composition |
| Natural organics | Surface resistance; flow decline may dominate | Source-water or TOC change; coagulation shift | TOC trend, FTIR or deposit characterisation | Often alkaline/surfactant route | Adsorption may coexist with biofilm |
| Oil or surfactant | Abrupt or local permeability loss | Process leak, cleaning carryover or upset | Incident trace and organic analysis | Supplier-approved alkaline/surfactant route | Acid first can worsen some deposits |
| Biofilm | Any stage; recurring pressure-drop pattern | Nutrients, dechlorination, dead legs or poor shutdown practice | ATP/culture trend and deposit microscopy | Supplier-approved biological/organic programme | Slime or odour is only a clue |
| Mixed deposit | Overlapping, stage-dependent signals | Several feed or control excursions | Multi-method deposit analysis | Deliberate compatible sequence | Wrong order can reduce cleanability |
Confirm the Root Cause Before You Select Cleaning Chemistry
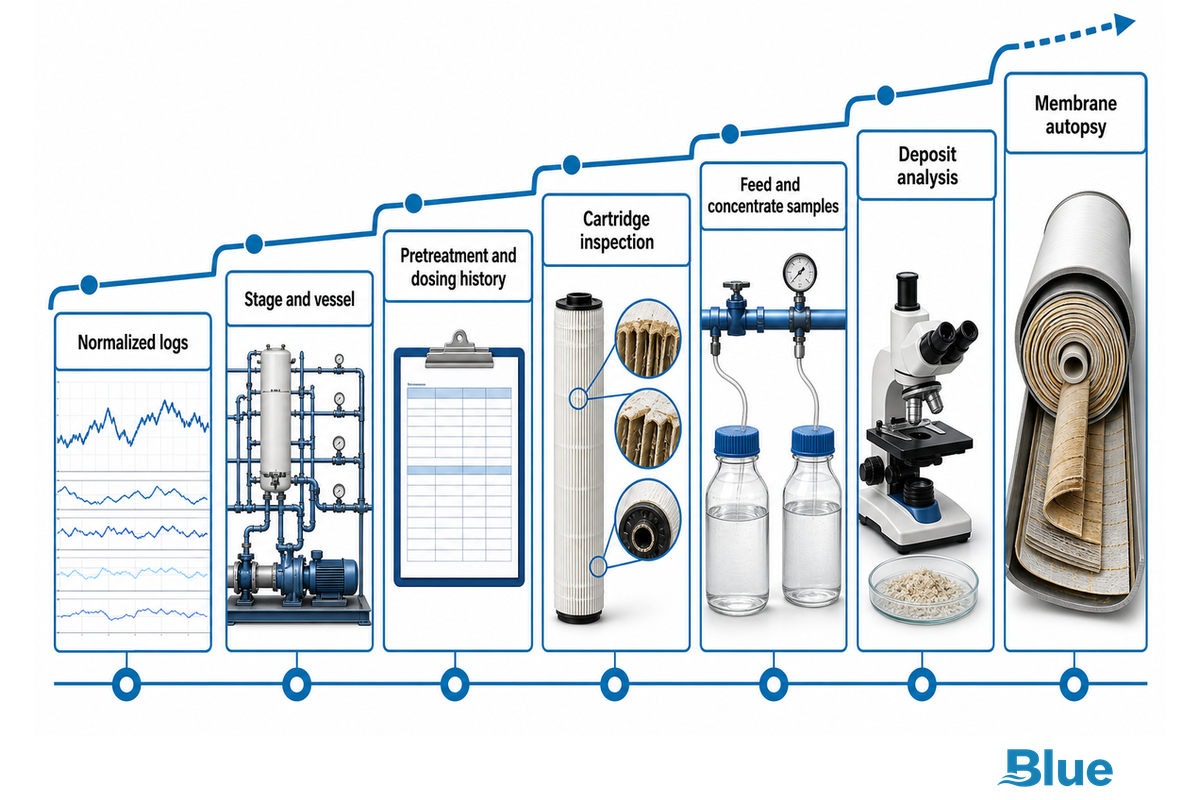
Direct answer: Move from working with low-cost operating evidence to physical evidence. Check normalized logs, identify the change by stage and vessel, check pretreatment and dosing history, inspect cartridges and/or retained solids, sample the feed and the concentrate, and perform deposit analysis or membrane autopsy when the consequence justifies it.
A symptom can rank hypotheses. It cannot turn a suspected foulant into a confirmed one.
Collect the last stable baseline, last effective clean, feed analysis, recovery, chemical dose, silt density index (SDI) or turbidity, total organic carbon (TOC) if relevant, microbial indicators, iron, aluminum, silica, hardness, alkalinity, pH, and shutdown events. Match timestamps. A pretreatment upset that preceded the membrane’s decline carries more weight than a test collected weeks later.
A 2026 full-scale industrial study combined 6 years of SCADA history with scanning electron microscopy and energy-dispersive X-ray spectroscopy (SEM, EDS). Trending the integrated data exposed deterioration earlier than one raw value; however, deposit analysis confirmed an organic-dominant layer. The study’s authors also noted that a different plant requires site-specific calibration.
Scenario 1: tail-stage flow declines after recovery was raised. Check concentrate chemistry and antiscalant delivery and analyze a deposit if available. The sequence tends to support a scale hypothesis, but doesn’t prove which mineral formed the scale.
Scenario 2: After a pretreatment upset, first-stage pressure drop increases.
Inspect cartridges and retained solids, check coagulant and polymer dosing, and compare vessels. Lead-stage location supports a colloid or metal carry-over hypothesis, but upstream feed-channel blockage can result in downstream disturbance.
Scenario 3: Salt passage and permeate flow increase.
Consider oxidation, seal leakage, mechanical breakdown, and sampling error. Deposits restricting permeability don’t always explain high-salt-passage, high-flow events.
Evidence-to-CIP Decision Ladder: From Symptom to Cleaning Chemistry
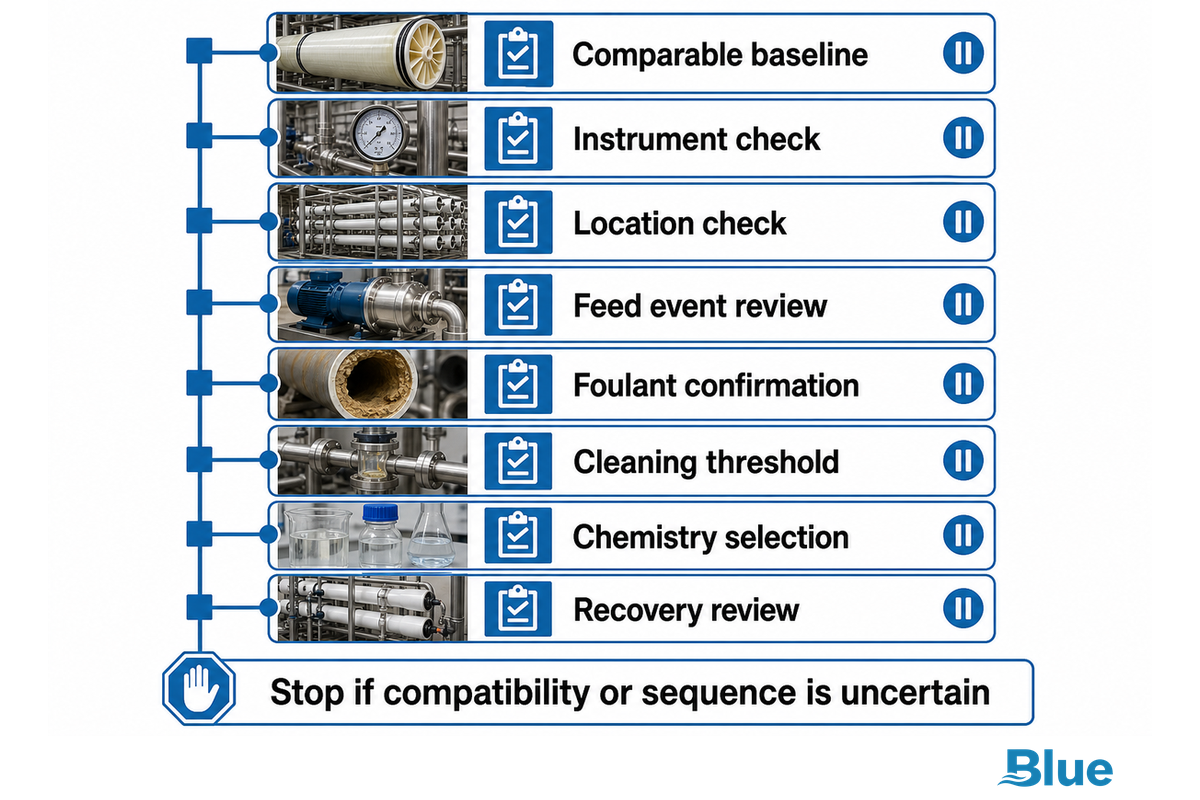
A practical route from a plant alarm to CIP is a five-decision ladder grounded in supplier cleaning procedures. Each step can stop the process if evidence is weak. This protects the membrane from incompatible chemistry and prevents a clean from masking an upstream fault.
| Decision checkpoint | Evidence and reference | Go or stop condition |
|---|---|---|
| Comparable baseline | Normalized flow, salt passage and pressure drop | Stop if the operating basis is not comparable |
| Instrument check | Calibration, sampling point and valve position | Stop if the signal cannot be trusted |
| Location check | Stage and vessel comparison | Continue only with a plausible hydraulic location |
| Feed event review | Feed-water, dosing, filter and shutdown history | Correct an active upstream upset before cleaning |
| Foulant confirmation | Retained solids, deposit sample and analytical evidence | Stop if the chemistry choice rests on appearance alone |
| Cleaning threshold | Verified normalized trend and supplier guidance | Clean when the installed element guidance is met |
| Chemistry selection | Element model, confirmed foulant and current manual | Stop if compatibility or sequence is uncertain |
| Recovery review | Post-CIP results on the same normalized basis | Reopen diagnosis if recovery is partial or short-lived |
Evidence-to-CIP Decision Ladder
- Confirm a real decline — normalize the three performance signals and rule out instrument or operating-point changes.
- Localise the change — compare stages, vessels, pressure points and the time order of events.
- Rank foulants — combine feed chemistry, pretreatment history and the fingerprint matrix.
- Confirm enough evidence — use retained solids, water tests, deposit analysis or autopsy according to risk.
- Select compatible chemistry — use the installed element supplier’s current limits for pH, temperature, concentration, flow, exposure and rinsing.
Acidic cleaning commonly targets certain mineral deposits, whereas alkaline and surfactant cleaning commonly targets organic and biological deposits. This is more of a trend than a rule. As per the FilmTec manual, alkaline cleaners are recommended in most cases, and commercial RO cleaning strategies retain those supplier-specific limits. The cited FilmTec manual reserves its acid-first sequence for cases where the known deposit consists only of calcium carbonate or iron oxide/hydroxide, while the same manual discusses alkaline cleaning first in other cases. Mixed deposits may require an alkaline cleaner first, followed by an acidic cleaner.
Cleaning in a specific order is important because the first cleaner may modify the deposits. Using a low-pH cleaner first may make oil, organics, and biological fouling harder to remove. A known mineral deposit may require a low-pH cleaner. Use the exact membrane model, safety data sheet (SDS), supplier procedure, and site chemical rules; don’t take a household cleaning procedure to a spiral-wound clean-in-place (CIP) array.
When to Clean, When to Investigate, and When to Replace
Clean when verified normalized deterioration reaches the installed supplier’s intervention guidance and the evidence supports a removable deposit. Investigate when readings aren’t comparable, the likely foulant is unclear, or if damage indicators are present. Replacement should only be considered after mechanical integrity, proper cleaning and root cause correction have been addressed.
| Outcome on normalized basis | Interpretation | Next action |
|---|---|---|
| Baseline substantially recovered and remains stable | Consistent with effective removal of a performance-limiting deposit | Verify the upstream corrective action and monitor |
| Only partial recovery | Residual deposit, wrong chemistry, poor hydraulics or damage | Reopen diagnosis; do not repeat blindly |
| Recovered, then declined rapidly | Root cause remains active or residual biofilm regrew | Trace pretreatment, nutrients, sanitation and shutdown practice |
| No useful recovery; damage indicators persist | Irreversible damage, compaction, severe deposit or mechanical fault | Probe, inspect or autopsy; evaluate replacement |
A recovered pressure drop shows hydraulic improvement, not a sterile surface or durable prevention. Record three outcomes separately: performance recovery, evidence of deposit removal, and recurrence of the issue. A short-term performance recovery shouldn’t be considered the resolution of a biofouling problem.
How to Run an Industrial RO CIP Without Locking In the Wrong Diagnosis
First, isolate the correct stage. Prepare the supplier-approved solution. Displace process water at low flow. Recirculate and soak as required. Manage each stage without driving foulant into another section. Rinse completely. Return the unit to service. Compare normalized performance and establish stability.
The FilmTec manual referenced here identifies six main steps: solution preparation, low-flow displacement, recycle, soak, high-flow circulation, and flush-out. The element family and deposit determine the allowable pH, temperature, concentration, flow rate, and exposure time. Generally speaking, follow the current supplier’s manual for the best results.
- Flush with permeate or water as stipulated by the element supplier.
- Check wetted materials for cleanliness and compatibility.
- Use the SDS and site procedure; never mix incompatible chemicals or expose workers and downstream systems.
- Follow the membrane’s oxidant limits. Damage to polyamide can lead to a high-flow, high-salt-passage pattern.
- Document solution condition, return appearance, differential pressure, temperature, time, and deviation.
Flushing doesn’t necessarily mean recovery. Stabilize the operating point prior to judging recovery. A post-clean hot or dilute feed can create a misleading improvement.
How to Stop RO Fouling From Coming Back
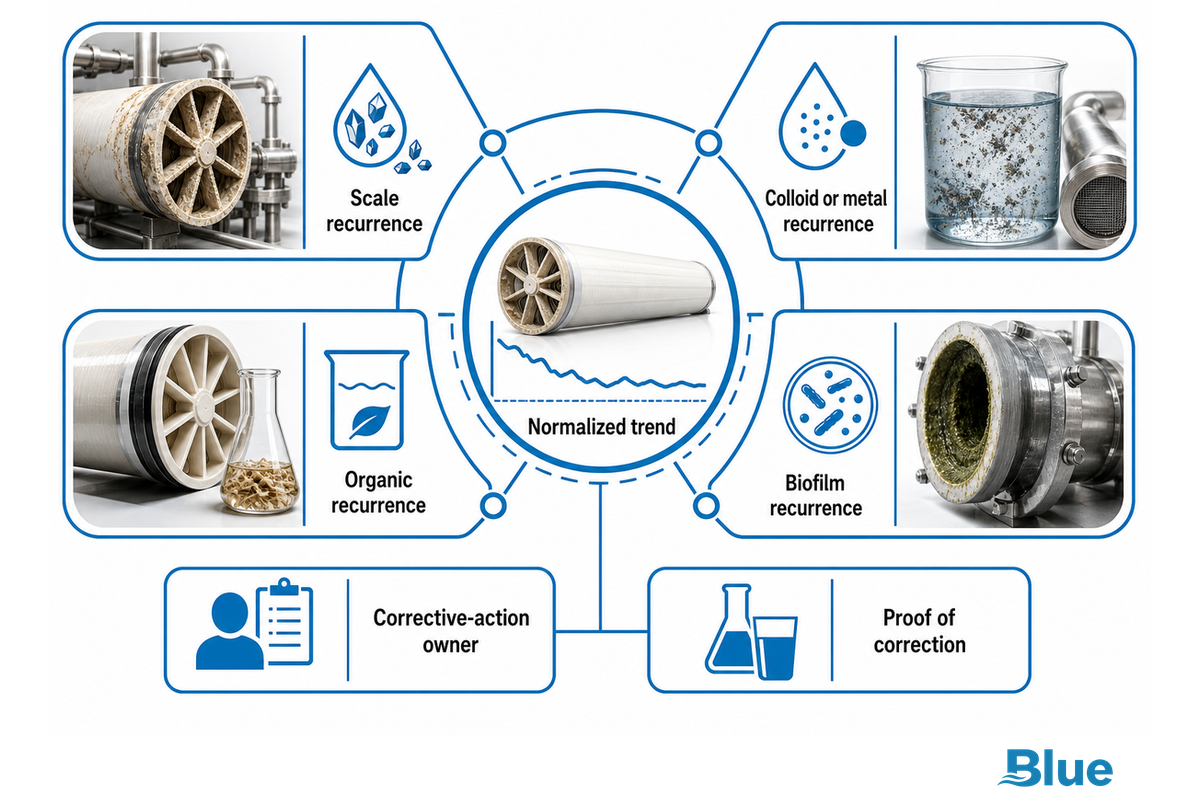
Prevention starts with the confirmed foulant and a named corrective-action owner. A directive to “improve pretreatment” isn’t helpful. Tie the deposit to the control that failed, the person who owns it, the documentation that proves correction, and the normalized trend that will validate whether the correction was sustained.
When an upstream filtration step (e.g. a UF membrane) is installed, evaluate the UF membrane’s integrity rather than assume it protects the RO process. A carbon filter can reduce an oxidant while changing the biological risk downstream. These interactions can affect membrane performance and biofouling risk across other types of fouling and fouling mechanisms, so they belong in fouling mitigation.
- Scale recurrence: recheck complete feed chemistry, recovery, pH, antiscalant choice and dose, mixing, pump calibration, and concentrate condition.
- Colloid or metal recurrence: check for breakthrough of pretreatment, filter loading, coagulant or polymer carryover, corrosion, and timing of upstream events.
- Organic recurrence: follow variations in source water and TOC, process contamination, coagulation and adsorption behavior.
- Biofilm recurrence: consider biodegradable substrate and nutrient loading as a separate pathway. Review dechlorination timing, sanitation, dead legs, idle periods, preservation, and monitoring cadence.
After restart, record normalized flow, normalized salt passage, stage pressure drop, recovery, feed temperature and conductivity, chemical changes, shutdowns, and a pass/fail note at a cadence defined by the site’s operating procedure. Identify recurrence of off-spec conditions before the array requires a costly cleaning.
If the root cause is variability in feed, recovery, or pretreatment capacity, refer to the existing system-level fouling-control guide and address the membrane as one of the control points, rather than the whole treatment strategy.
When a Fouling-Resistant RO Element Makes Sense
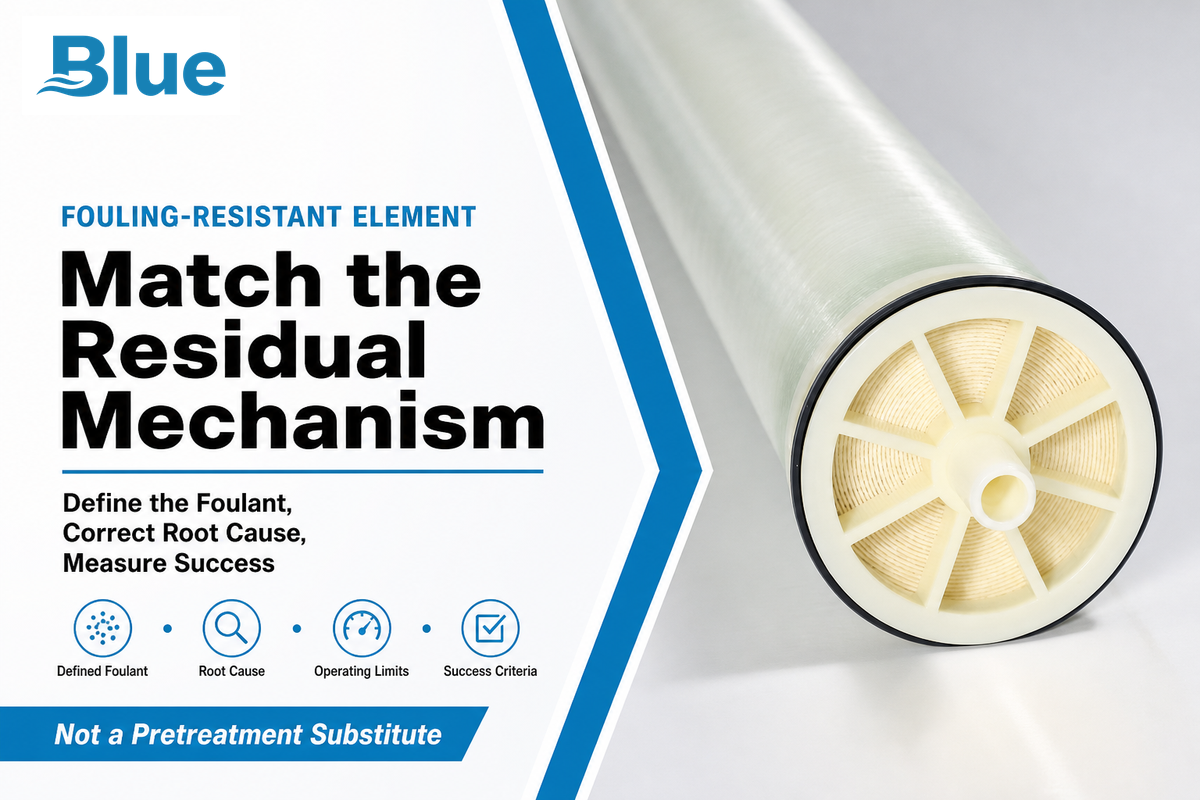
A fouling-resistant element could be considered when four conditions are true: the predominant foulant has been defined; the upstream root cause has been corrected, if possible; the element in question aligns with the residual mechanism and operating limits; success has been defined as a lower rate of decline or increased run time, or improved cleanability. The element doesn’t replace pretreatment, scale control, sanitation, monitoring, or cleaning.
For surface technology and vendor claims, and element versus pretreatment trade-offs, refer to the fouling-resistant membrane buyer guide. For element specifications and engineering selection, use Blue Membrane’s fouling-resistant element solution page.
Diagnosis-to-Action Summary
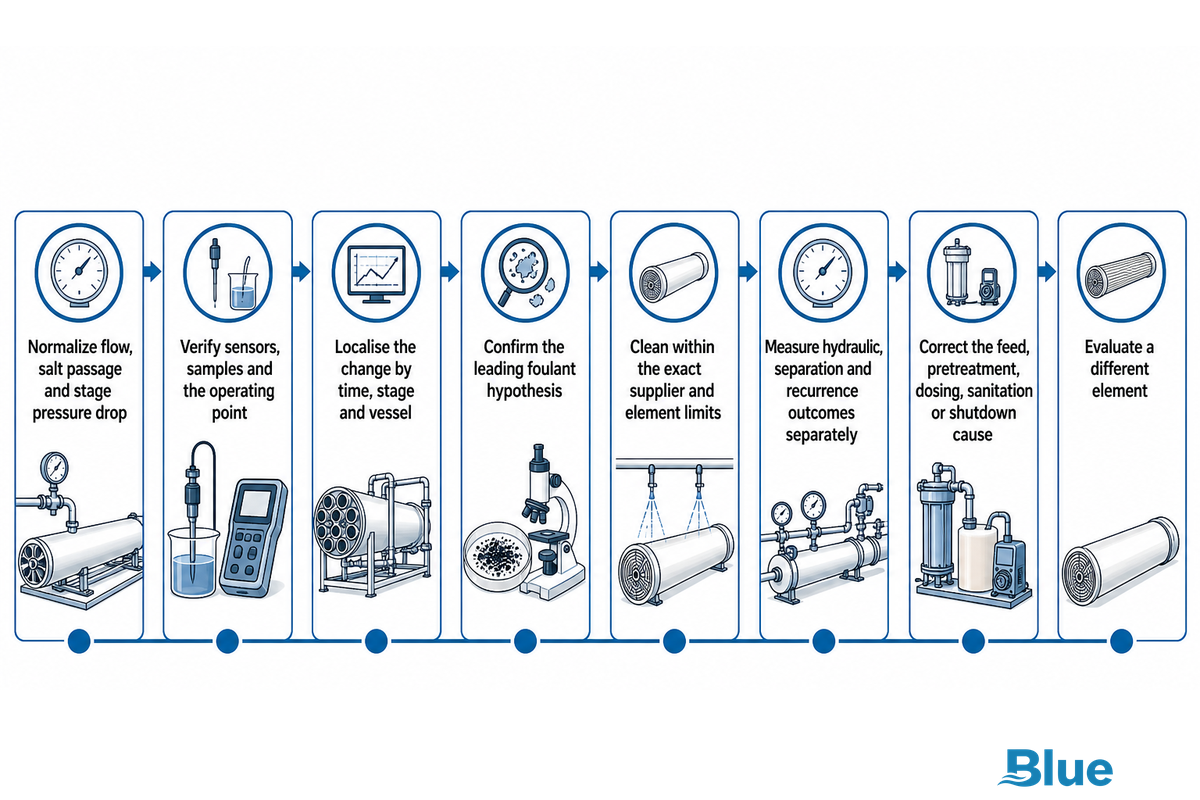
- Normalize flow, salt passage and stage pressure drop.
- Verify sensors, samples and the operating point.
- Localise the change by time, stage and vessel.
- Confirm the leading foulant hypothesis with proportionate evidence.
- Clean within the exact supplier and element limits.
- Measure hydraulic, separation and recurrence outcomes separately.
- Correct the feed, pretreatment, dosing, sanitation or shutdown cause.
- Evaluate a different element only with respect to a defined residual mechanism.
Bring the evidence to an engineering review
Bring feed chemistry, the current element model, a clean baseline, stage-specific trends and cleaning history to the discussion. The company manufactures RO membrane elements and supplies integrated water-treatment systems for industrial, municipal, marine and commercial applications.
Frequently Asked Questions
Can I diagnose RO membrane fouling from differential pressure alone?
No. Differential pressure is one of three useful normalized signals, alongside normalized permeate flow and normalized salt passage. A rise can indicate feed-channel blockage, but valve position, sensor error, flow redistribution, or an upstream obstruction may produce a similar pattern. Compare stages and vessels, confirm a stable operating basis, and use feed or deposit evidence before assigning a foulant. Also check the time order: a blockage in an upstream stage can alter downstream flow and pressure, so the largest displayed change doesn’t necessarily mark the original deposit location.
Can a reverse osmosis membrane be cleaned?
Many industrial spiral-wound RO membranes can be cleaned in place when the problem is a compatible, removable deposit and the procedure stays within the element supplier’s limits. Cleaning can’t reverse every form of oxidation, abrasion, compaction, telescoping, seal failure, or severe mineral deposition. Household filter-soaking advice isn’t a substitute for an industrial CIP procedure. The useful test is normalized recovery after stable restart, not how much colour leaves the cleaning tank.
Which chemical is best for RO membrane cleaning?
There’s no universal best cleaner. The foulant, membrane material, element model, mixed-deposit risk and supplier limits determine the chemical cleaning agents and sequence. Acidic systems often address particular mineral deposits, while alkaline and surfactant systems often address organics and biological material. Confirm the likely deposit and use the current supplier procedure before setting concentration, pH, temperature, flow or exposure. Cleaning order also matters: supplier guidance may call for an alkaline-first sequence on mixed organic, biological and mineral deposits, while a known carbonate or iron deposit may justify acid first. Confirm that the tank, filter, pump, heater, hoses and wetted fittings tolerate the selected solution. Record the return condition and stop if an unsafe reaction, incompatible material or out-of-limit condition appears. Use the current manual for the installed element, not a generic recipe.
How do I know whether an RO membrane is fouled or permanently damaged?
Start with normalized membrane-performance patterns and rule out instruments and operating conditions. High salt passage with unexpectedly high permeate flux can suggest membrane damage rather than simple deposition; seal or interconnector leakage is a separate cause of poor permeate quality. A correctly selected cleaning trial adds evidence: substantial stable recovery supports a removable foulant; poor recovery plus persistent damage indicators calls for vessel probing, inspection, or autopsy before replacement.
Does a fouling-resistant membrane eliminate cleaning or pretreatment?
No. A fouling-resistant element may slow a defined membrane fouling mechanism or improve cleanability under suitable conditions, but it doesn’t remove the need for pretreatment, antiscalant control, sanitation, monitoring or CIP. Define success as a slower decline, longer run or better cleanability, then compare the residual foulant mechanism with the technology and supplier evidence in the dedicated buyer guide.
References & Sources
- DuPont FilmTec Reverse Osmosis Membranes Technical Manual, Version 20, August 2026.
- Hydranautics Technical Service Bulletin 107: RO/NF Membrane Foulants and Cleaning Procedures.
- DuPont FilmTec Cleaning Procedures Manual.
- Full-scale industrial RO fouling diagnosis using six years of SCADA and SEM, EDS data, Cleaner Water, 2026.
- Reverse osmosis membrane fouling and cleaning review, Heliyon, 2023.
- U.S. FDA Reverse Osmosis Inspection Guide.
Blue Membrane manufactures RO membrane elements and supplies nanofiltration elements and complete RO systems. First-party background is available in the company profile.